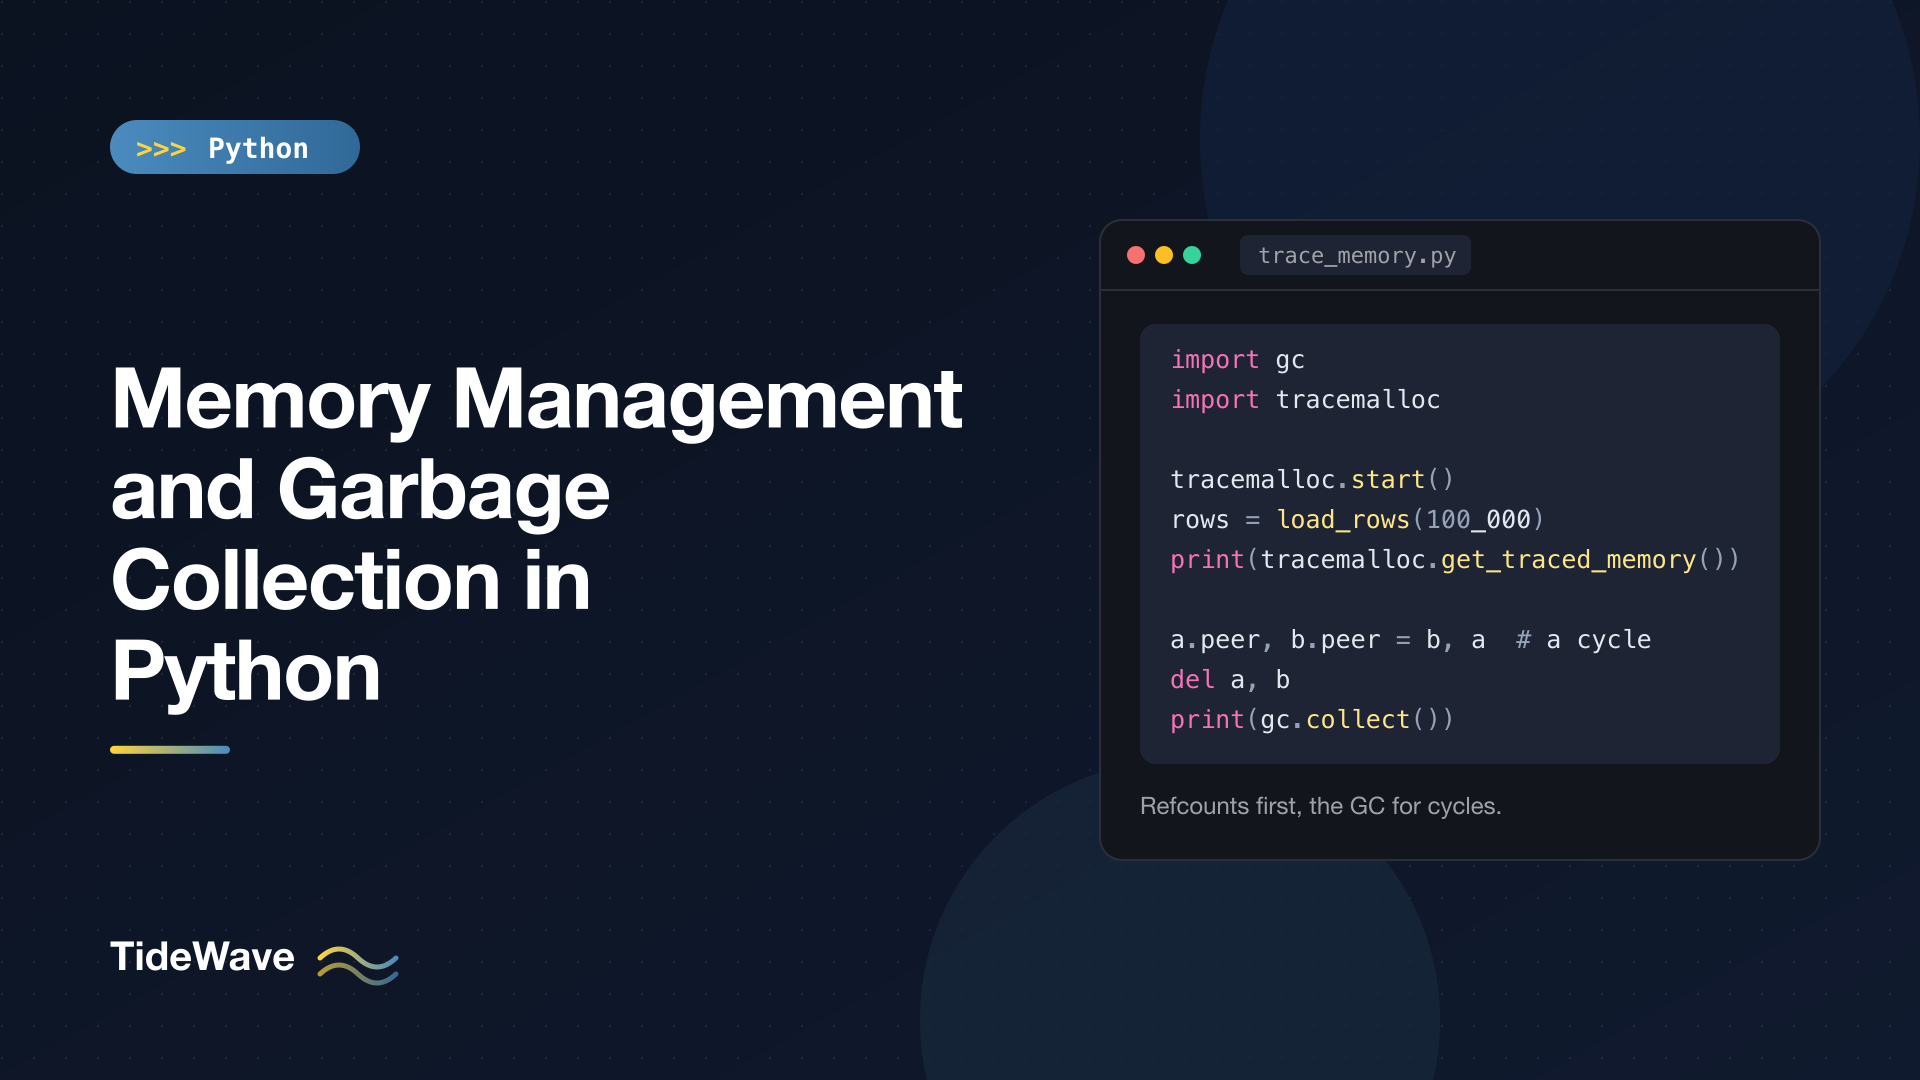
Memory Management and Garbage Collection in Python
Python frees you from malloc and free. You create objects, use them, and at some point they disappear. Most of the time you never think about it. Then a long-running worker slowly climbs to 4 GB, or a script that processes a big file gets killed by the OS, and you need to know what's actually going on underneath.
This post explains how CPython, the standard Python interpreter, manages memory. I'll cover reference counting (the main mechanism), the cyclic garbage collector (the backup for reference cycles), weak references and finalizers, how to measure object sizes, and how to track down leaks and memory-hungry code with tracemalloc. All the examples were run on Python 3.13.
Names, Objects, and References
In Python, variables don't hold values. They're names bound to objects that live on the heap. Assigning one variable to another doesn't copy the object; it adds another reference to the same object.
a = [1, 2, 3]
b = a          # b and a refer to the same list
b.append(4)
print(a)       # [1, 2, 3, 4]
An object stays alive as long as something refers to it: a variable, a list element, a dictionary value, an attribute, a closure, a stack frame. When nothing refers to it anymore, its memory can be reclaimed. The interesting question is how CPython figures out when that happens.
Reference Counting
Every object in CPython carries a reference count: the number of references currently pointing at it. The interpreter increments it when a new reference is created and decrements it when a reference goes away. When the count drops to zero, the object is deallocated immediately.
You can peek at the count with sys.getrefcount():
# refcount.py
import sys

data = [1, 2, 3]
print(sys.getrefcount(data))  # +1 for the argument to getrefcount

alias = data
print(sys.getrefcount(data))

container = {"items": data}
print(sys.getrefcount(data))

del alias
container.clear()
print(sys.getrefcount(data))
2
3
4
2
The number is always one higher than you'd expect, because passing data to getrefcount() temporarily creates another reference. Each new name or container slot adds one; del and removing it from the dict take them away again.
Things that add a reference:
- binding a name (
x = obj) - putting the object in a container (
items.append(obj)) - passing it as an argument (for the duration of the call)
- storing it as an attribute (
self.thing = obj)
Things that remove one:
del x(which deletes the name, not the object)- rebinding the name (
x = something_else) - the name going out of scope when a function returns
- removing the object from a container
Why Reference Counting Is Nice
Deallocation is deterministic. The moment the last reference goes away, the object is cleaned up. That's why this works reliably in CPython:
def read_header(path: str) -> str:
    f = open(path)
    return f.readline()
    # f's refcount drops to zero here, and the file is closed
That said, don't rely on it. Other implementations like PyPy don't use reference counting and may close the file much later. Use a with statement for anything that needs cleanup.
del is often misunderstood for the same reason. It doesn't destroy an object; it removes one reference. If other references exist, the object lives on.
The Problem: Reference Cycles
Reference counting has one blind spot. If objects refer to each other in a cycle, their counts never reach zero, even when nothing outside the cycle can reach them:
class Node:
    def __init__(self, name: str) -> None:
        self.name = name
        self.peer: "Node | None" = None


a = Node("a")
b = Node("b")
a.peer = b
b.peer = a   # a -> b -> a

del a, b     # both objects still have refcount 1, from each other
Cycles are common in real code: parent and child nodes that point to each other, doubly linked lists, an object that stores a bound method of itself, an exception that holds a traceback that references the frame that holds the exception. Without help, every cycle would leak.
The Cyclic Garbage Collector
CPython's answer is a second mechanism, the cyclic garbage collector, in the gc module. It periodically looks at container objects (lists, dicts, class instances, and others that can hold references) and finds groups that are only reachable from each other. Those groups are garbage, and it frees them.
You can watch it work. This example disables automatic collection so the timing is predictable, and uses a weak reference to observe an object without keeping it alive:
# cycles.py
import gc
import weakref


class Node:
    def __init__(self, name: str) -> None:
        self.name = name
        self.peer: "Node | None" = None


gc.disable()  # keep the automatic collector out of the way for the demo
gc.collect()  # start from a clean slate

a = Node("a")
b = Node("b")
a.peer = b
b.peer = a  # a -> b -> a: a reference cycle

watch = weakref.ref(a)  # observe a without keeping it alive
del a, b

print("alive after del:", watch() is not None)
print("collected:", gc.collect())
print("alive after collect:", watch() is not None)

gc.enable()
alive after del: True
collected: 2
alive after collect: False
After del, the two nodes are unreachable but still alive. Running gc.collect() finds the cycle, frees both objects, and returns the number of unreachable objects it found.
Generations and Thresholds
Scanning every object on every collection would be slow, so the collector is generational. It's based on the observation that most objects die young:
- New container objects start in the youngest generation.
- Objects that survive a collection get promoted to an older generation.
- Younger generations are collected often; older ones rarely.
Collections are triggered by allocation counts, configured by thresholds:
import gc

print(gc.get_threshold())
print(gc.isenabled())
(2000, 10, 10)
True
Roughly: a young-generation collection runs when allocations minus deallocations of tracked objects exceed 2,000, and older generations are scanned after a number of younger collections. The exact scheduling is an implementation detail that has changed between versions, so don't write code that depends on it.
Only objects that can participate in cycles are tracked. Integers and strings can't hold references to other objects, so the collector ignores them entirely. CPython even untracks some containers when it's safe:
import gc

print(gc.is_tracked([]), gc.is_tracked(42), gc.is_tracked("text"))
print(gc.is_tracked({"a": 1}), gc.is_tracked({"a": []}))
True False False
False True
A dict holding only atomic values can't be part of a cycle, so it isn't tracked until it holds a container.
Controlling the Collector
The gc module gives you a few levers:
| Function | What it does |
|---|---|
gc.collect(generation=2) | Run a collection now and return the number of unreachable objects found |
gc.disable() / gc.enable() | Turn automatic collection off or on (reference counting still works) |
gc.set_threshold(...) | Change how often collections happen |
gc.freeze() | Move all current objects to a permanent generation the collector ignores |
gc.get_objects() | List every tracked object (useful for debugging, slow) |
gc.get_referrers(obj) | Find what refers to an object (debugging only) |
gc.callbacks | Register functions called before and after each collection |
Most applications never need to touch these. Two legitimate uses:
- Latency-sensitive code sometimes disables automatic collection around a critical section and calls
gc.collect()at a convenient moment. - Pre-fork servers call
gc.freeze()after loading the app and before forking workers. The collector then doesn't touch those objects, which keeps memory pages shared between processes instead of copied.
Disabling the collector permanently is a bad idea unless you're sure your code creates no cycles. Any cycle will then leak.
Weak References
Sometimes you want to refer to an object without keeping it alive. Caches, observer lists, and parent pointers in trees are typical examples. The weakref module provides references that don't increase the reference count.
WeakValueDictionary for Caches
A WeakValueDictionary drops entries automatically when the values are no longer used anywhere else:
# weak_cache.py
import gc
import weakref


class Image:
    def __init__(self, path: str) -> None:
        self.path = path


cache: weakref.WeakValueDictionary[str, Image] = weakref.WeakValueDictionary()

img = Image("logo.png")
cache["logo"] = img
print("in cache:", "logo" in cache)

del img
gc.collect()
print("in cache after del:", "logo" in cache)
in cache: True
in cache after del: False
While anything in your program uses the image, the cache returns it. Once the last strong reference is gone, the entry disappears. In CPython the entry is removed as soon as the refcount hits zero; the gc.collect() call just makes the example behave the same on other implementations. There's also WeakKeyDictionary and WeakSet.
To break a parent/child cycle, store the back-reference as a weak reference: self.parent = weakref.ref(parent), then call self.parent() to get the object (or None if it's gone).
Not every type supports weak references. Instances of your own classes do by default. Built-in list and dict don't, and classes that define __slots__ need to include "__weakref__" in the slots to support them.
Cleanup with weakref.finalize
If you need to run cleanup when an object is garbage collected, weakref.finalize is more reliable than defining __del__:
# finalize.py
import weakref


class TempFile:
    def __init__(self, path: str) -> None:
        self.path = path
        weakref.finalize(self, print, f"cleaning up {path}")


f = TempFile("/tmp/report.csv")
del f
print("done")
cleaning up /tmp/report.csv
done
The finalizer runs when the object is collected, and it's also guaranteed to run at interpreter exit if the object is still alive. __del__ methods, by contrast, can run at awkward times, may see partially torn-down module globals at shutdown, and can accidentally resurrect objects. For resources you control, a context manager is still the best option; finalizers are a safety net.
How Big Are Objects?
sys.getsizeof() returns the size of an object in bytes:
# sizes.py
import sys

for obj in [0, 1, 2**100, 1.5, "", "hello", [], [1, 2, 3], (), {}, set()]:
    print(f"{obj!r:>35}  {sys.getsizeof(obj)} bytes")
                                  0  28 bytes
                                  1  28 bytes
    1267650600228229401496703205376  40 bytes
                                1.5  24 bytes
                                 ''  41 bytes
                            'hello'  46 bytes
                                 []  56 bytes
                          [1, 2, 3]  88 bytes
                                 ()  40 bytes
                                 {}  64 bytes
                              set()  216 bytes
These numbers are from a 64-bit build of 3.13 and may differ elsewhere. Two takeaways:
- Python objects are big. A small integer takes 28 bytes, compared to 8 in a C array. A million floats in a list cost the list's 8 MB of pointers plus 24 MB of float objects.
getsizeofis shallow. For[1, 2, 3]it counts the list's pointer array, not the integers inside. To measure a whole structure, usetracemalloc(below) rather than summinggetsizeofrecursively.
Small Integers and Interning
CPython caches some immutable objects so they're shared instead of duplicated. Integers from -5 to 256 are preallocated, and many short strings, like identifiers, are interned:
a = 256
b = int("256")
print(a is b)  # True: same cached object

c = 257
d = int("257")
print(c is d)  # False: two separate objects
This is why you must compare values with ==, not is. Whether is happens to work for numbers or strings is an implementation detail.
Under the Hood: pymalloc
CPython doesn't call the system allocator for every small object. It uses its own allocator, pymalloc, which carves memory into pools for objects up to 512 bytes. This makes allocation fast, but it has a side effect: memory freed by Python objects often goes back to pymalloc's pools for reuse rather than back to the operating system. A process's resident memory may stay high after a big structure is freed, even though Python can reuse that memory for new objects. That isn't a leak.
Finding Memory Problems with tracemalloc
The standard library's tracemalloc module records where every memory block was allocated. It's the first tool to reach for when you want to know what's using memory.
Measuring Current and Peak Usage
# trace_memory.py
import tracemalloc


def load_rows(n: int) -> list[dict[str, object]]:
    return [{"id": i, "name": f"user{i}", "tags": ["a", "b"]} for i in range(n)]


tracemalloc.start()

rows = load_rows(100_000)

current, peak = tracemalloc.get_traced_memory()
print(f"current: {current / 1_000_000:.1f} MB, peak: {peak / 1_000_000:.1f} MB")

snapshot = tracemalloc.take_snapshot()
for stat in snapshot.statistics("lineno")[:3]:
    print(stat)

tracemalloc.stop()
current: 34.6 MB, peak: 34.6 MB
trace_memory.py:6: size=33.0 MiB, count=599714, average=58 B
trace_memory.py:14: size=144 B, count=3, average=48 B
trace_memory.py:13: size=64 B, count=2, average=32 B
(File paths are shortened here; you'll see full paths.) 100,000 small dicts with a string and a list each cost about 33 MB, all allocated on line 6. statistics("lineno") groups allocations by source line; "filename" and "traceback" are the other grouping options.
Hunting Leaks with Snapshot Diffs
A leak in Python is almost always something that keeps references it shouldn't: a module-level list or dict that only grows, a cache with no limit, event handlers that are registered and never removed. To find it, take a snapshot before and after the suspect operation and compare:
# leak_hunt.py
import tracemalloc

_seen: list[str] = []


def handle_request(i: int) -> None:
    _seen.append(f"request-{i}" * 10)  # oops: grows forever


tracemalloc.start()
before = tracemalloc.take_snapshot()

for i in range(10_000):
    handle_request(i)

after = tracemalloc.take_snapshot()
for stat in after.compare_to(before, "lineno")[:2]:
    print(stat)
leak_hunt.py:8: size=1645 KiB (+1645 KiB), count=10001 (+10001), average=168 B
.../tracemalloc.py:560: size=328 B (+328 B), count=1 (+1), average=328 B
The diff points straight at line 8, with 10,001 new blocks. In a real service you'd take the first snapshot after warm-up, run a batch of requests, and take the second. Lines that grow in proportion to the number of requests are your suspects.
Common sources of Python memory leaks:
- Unbounded caches, including
@functools.cacheon functions called with many distinct arguments - Module-level lists, dicts, or sets used as registries
- Callbacks and signal handlers that hold references to large objects
- Storing exceptions (which hold tracebacks, which hold frames, which hold every local variable)
- C extensions that leak at the native level, which
tracemalloccan't see
Writing Memory-Friendly Code
Most memory savings come from not holding everything at once.
Stream Instead of Loading
A generator produces one item at a time instead of materializing a whole list:
# lazy_memory.py
import tracemalloc

tracemalloc.start()
total = sum([x * x for x in range(1_000_000)])
_, peak_list = tracemalloc.get_traced_memory()
tracemalloc.reset_peak()

total = sum(x * x for x in range(1_000_000))
_, peak_gen = tracemalloc.get_traced_memory()
tracemalloc.stop()

print(f"list comprehension peak: {peak_list / 1_000_000:.1f} MB")
print(f"generator peak:          {peak_gen / 1_000:.1f} KB")
list comprehension peak: 40.4 MB
generator peak:          1.0 KB
Same result, 40 MB versus 1 KB at peak. Iterate over files line by line, use generators in pipelines, and read databases with cursors instead of fetching everything. See What Is a Generator in Python for more.
Use __slots__ for Many Small Objects
Instances normally store attributes in a per-instance dictionary. Declaring __slots__ replaces it with fixed storage:
# slots_memory.py
import tracemalloc


class Point:
    def __init__(self, x: float, y: float) -> None:
        self.x = x
        self.y = y


class SlotPoint:
    __slots__ = ("x", "y")

    def __init__(self, x: float, y: float) -> None:
        self.x = x
        self.y = y


for cls in (Point, SlotPoint):
    tracemalloc.start()
    points = [cls(i, i) for i in range(100_000)]
    current, _ = tracemalloc.get_traced_memory()
    tracemalloc.stop()
    print(f"{cls.__name__:<10} {current / 1_000_000:.1f} MB")
Point      12.8 MB
SlotPoint  8.8 MB
About 30% less. The gap was larger in older Pythons; recent CPython versions already store instance attributes more compactly. Dataclasses support this with @dataclass(slots=True).
Use Compact Representations
- Store large numeric data in NumPy arrays or
array.array, which hold raw values instead of Python objects. - Use tuples or named tuples instead of dicts for many small fixed-shape records.
- Process data in chunks (pandas
chunksize, database cursors) rather than all at once. dellarge intermediate results you no longer need inside long functions, so they don't live until the function returns.
Free-Threaded Builds
The free-threaded builds of Python 3.13 and 3.14 change how reference counting works internally (using biased reference counting and immortal objects so threads don't fight over counters), but the model you program against is the same: objects die when unreachable, and the cyclic collector handles cycles. Understanding the GIL and Free-Threaded Python covers those builds.
Conclusion
CPython manages memory with two cooperating mechanisms. Reference counting frees most objects immediately, the moment the last reference disappears. The cyclic garbage collector periodically finds groups of objects that only reference each other and frees those too. Weak references let you point at objects without keeping them alive, and weakref.finalize gives you dependable cleanup hooks.
When memory becomes a problem, measure it: tracemalloc shows where allocations come from and, with snapshot diffs, what's growing. The fix is usually structural: stream data instead of loading it, bound your caches, avoid long-lived registries, and use compact representations for large collections.