Monitoring and Error Tracking in Next.js with Sentry and OpenTelemetry
In development, Next.js shows you every error in a big red overlay. In production, an error in a Server Component turns into a generic "Something went wrong" page and a short digest string, and that's all your user sees. Unless you've set something up to catch it, that's all you'll see too. Meanwhile a page that suddenly takes four seconds to render won't throw at all; it'll just quietly lose you visitors.
Production monitoring for a Next.js app covers two related jobs. Error tracking tells you what broke, where, for whom, and with what stack trace. Tracing tells you where time goes inside a request: rendering, data fetching, a slow database query. Sentry is the most common choice for the first, and OpenTelemetry is the open standard for the second. Next.js has hooks for both built in.
This post covers the Next.js instrumentation files, setting up Sentry for server, edge, and browser errors, wiring up error boundaries, uploading source maps, adding OpenTelemetry tracing with custom spans, correlating logs with traces, and keeping volume and cost under control.
The Building Blocks Next.js Gives You
Before adding any vendor, it helps to know the three hooks Next.js provides. Every monitoring tool plugs into these.
| File or export | Runs where | Purpose |
|---|---|---|
instrumentation.ts → register() | Server, once per server instance at startup | Initialize SDKs and tracers before any request is handled |
instrumentation.ts → onRequestError() | Server, on every uncaught server error | Report errors from rendering, Route Handlers, Server Actions, and proxy.ts |
instrumentation-client.ts | Browser, before the app becomes interactive | Initialize client-side SDKs, track navigations |
Both files live in the project root (or in src/ if you use one), next to app/, not inside it.
What onRequestError Receives
onRequestError is called with the error, a description of the request, and context about where the error happened:
// instrumentation.ts
import type { Instrumentation } from "next";

export const onRequestError: Instrumentation.onRequestError = async (
  error,
  request,
  context,
) => {
  const err = error as Error & { digest?: string };

  console.error(
    JSON.stringify({
      level: "error",
      message: err.message,
      digest: err.digest,
      path: request.path,
      method: request.method,
      routePath: context.routePath,
      routeType: context.routeType, // "render" | "route" | "action" | "proxy"
    }),
  );
};
context.routeType tells you whether the error came from rendering a page, a Route Handler, a Server Action, or proxy.ts. The digest is the same string shown in the client's error boundary, which lets you match a user's screenshot to a server log entry. Even this vendor-free version is a big improvement over nothing: structured JSON logs that your hosting platform can search.
Setting Up Sentry
Sentry's Next.js SDK, @sentry/nextjs, hooks into all three building blocks. The quickest path is the setup wizard, which installs the package, creates the config files, and adds an example page:
npx @sentry/wizard@latest -i nextjs
It's worth understanding the files it creates, so let's go through them by hand.
Server and Edge Initialization
Next.js can run server code in two runtimes: Node.js and Edge. Sentry needs a separate init for each, loaded from register():
// sentry.server.config.ts
import * as Sentry from "@sentry/nextjs";

Sentry.init({
  dsn: process.env.SENTRY_DSN,
  environment: process.env.APP_ENV ?? "development",
  release: process.env.SENTRY_RELEASE,
  tracesSampleRate: process.env.NODE_ENV === "production" ? 0.1 : 1.0,
  sendDefaultPii: false,
});
// sentry.edge.config.ts
import * as Sentry from "@sentry/nextjs";

Sentry.init({
  dsn: process.env.SENTRY_DSN,
  environment: process.env.APP_ENV ?? "development",
  tracesSampleRate: process.env.NODE_ENV === "production" ? 0.1 : 1.0,
});
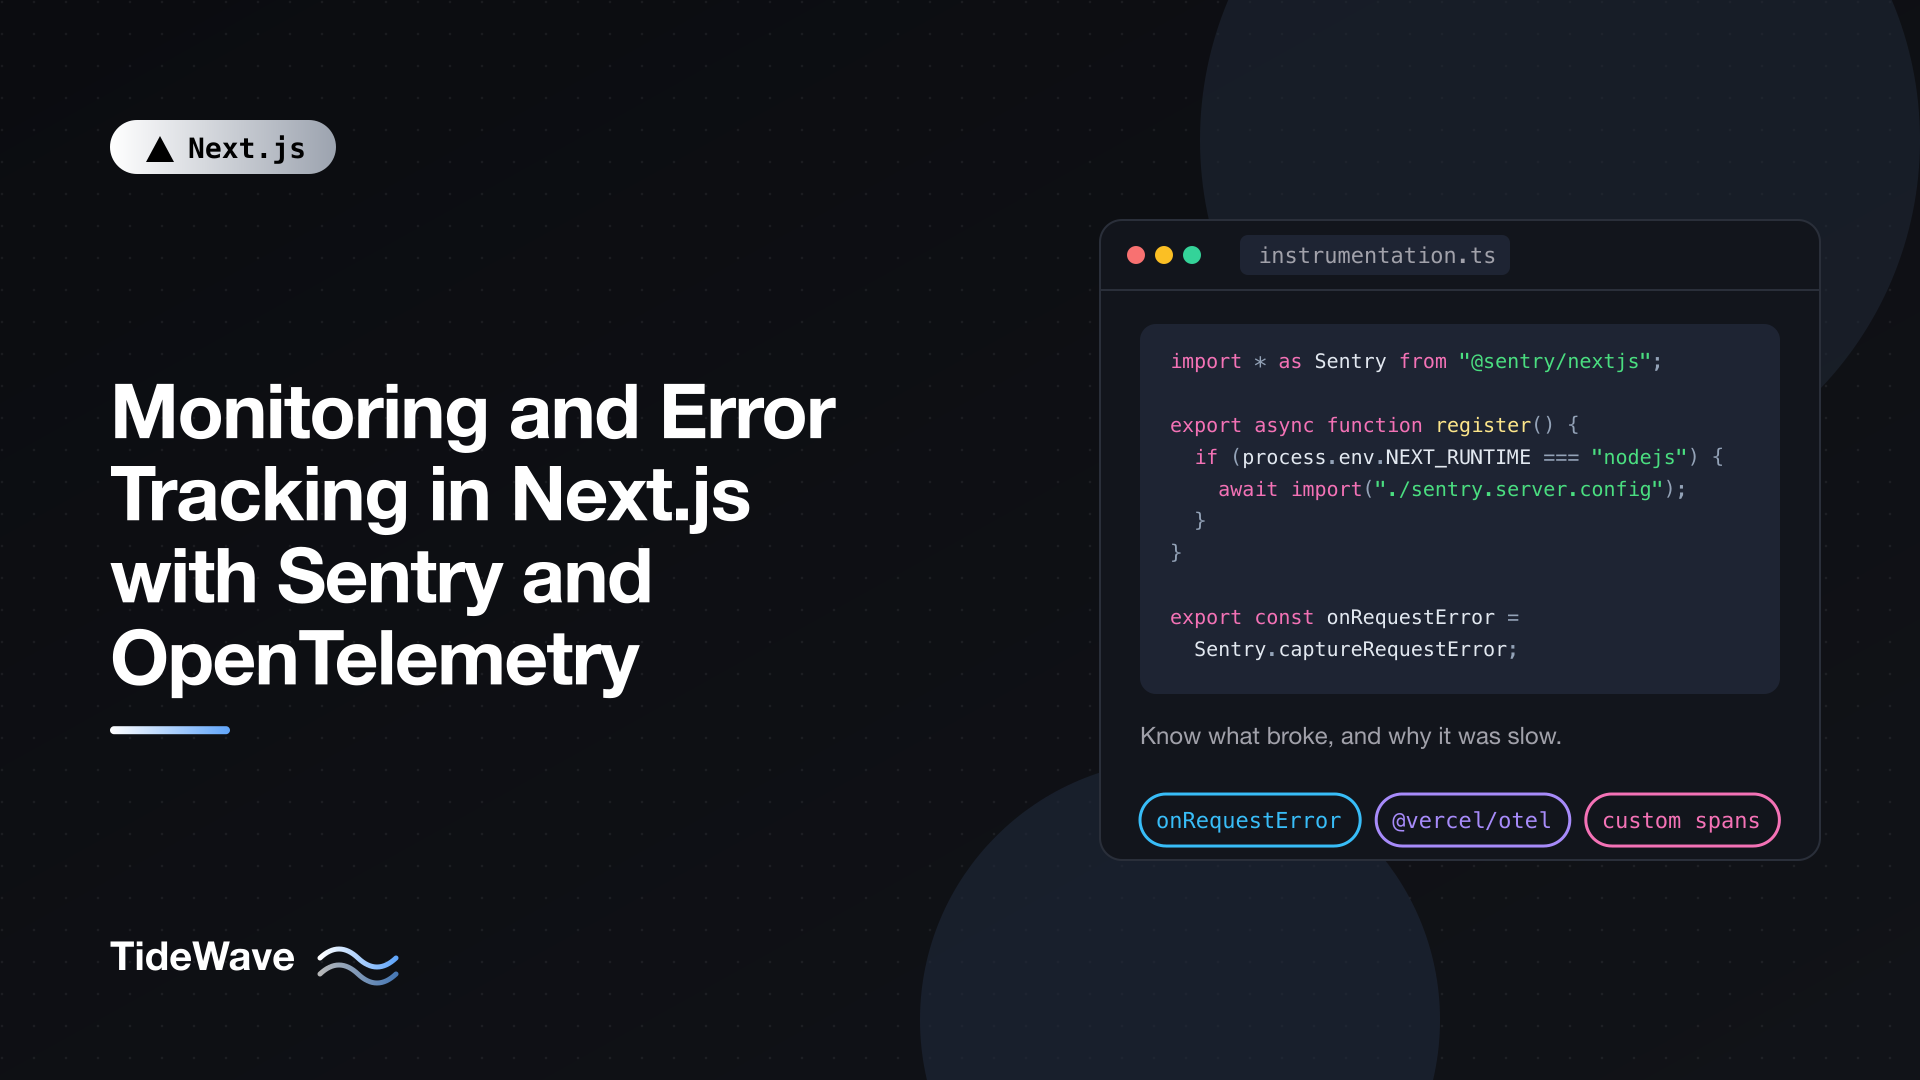
// instrumentation.ts
import * as Sentry from "@sentry/nextjs";

export async function register() {
  if (process.env.NEXT_RUNTIME === "nodejs") {
    await import("./sentry.server.config");
  }
  if (process.env.NEXT_RUNTIME === "edge") {
    await import("./sentry.edge.config");
  }
}

export const onRequestError = Sentry.captureRequestError;
register() checks NEXT_RUNTIME and imports only the config for the current runtime, so Node-only code never ends up in the edge bundle. Sentry.captureRequestError is a ready-made onRequestError handler that sends server errors to Sentry with the route, request method, and context attached. That one line catches errors in Server Components, Route Handlers, Server Actions, and proxy.ts.
tracesSampleRate controls what fraction of requests get performance traces. Errors are always captured; sampling only applies to traces. Start low in production and raise it if you need more detail.
Client Initialization
// instrumentation-client.ts
import * as Sentry from "@sentry/nextjs";

Sentry.init({
  dsn: process.env.NEXT_PUBLIC_SENTRY_DSN,
  environment: process.env.NEXT_PUBLIC_APP_ENV ?? "development",
  tracesSampleRate: 0.1,
  integrations: [Sentry.replayIntegration()],
  replaysSessionSampleRate: 0,
  replaysOnErrorSampleRate: 1.0,
});

export const onRouterTransitionStart = Sentry.captureRouterTransitionStart;
This runs in the browser before hydration. It captures unhandled exceptions and promise rejections automatically. The client DSN needs the NEXT_PUBLIC_ prefix because it's inlined into the browser bundle; a Sentry DSN is designed to be public, so that's fine.
onRouterTransitionStart is a Next.js hook that fires when an App Router navigation begins. Exporting Sentry's handler lets it trace client-side navigations, not just full page loads.
Session Replay records a privacy-masked replay of the user's session. With replaysSessionSampleRate: 0 and replaysOnErrorSampleRate: 1.0, you only keep replays for sessions that hit an error, which is where they're most useful. Replay adds weight to the client bundle, so drop the integration if you don't need it.
Wrapping the Next.js Config
// next.config.ts
import type { NextConfig } from "next";
import { withSentryConfig } from "@sentry/nextjs";

const nextConfig: NextConfig = {
  // your existing options
};

export default withSentryConfig(nextConfig, {
  org: "your-org",
  project: "your-project",
  authToken: process.env.SENTRY_AUTH_TOKEN,
  silent: !process.env.CI,
  widenClientFileUpload: true,
  tunnelRoute: "/monitoring",
});
withSentryConfig does two important things at build time:
- Uploads source maps. Production JavaScript is minified, so a raw stack trace points at
chunk-8f2a.js:1:48213. With source maps uploaded to Sentry (usingSENTRY_AUTH_TOKEN), you see the original file, line, and code. The maps are uploaded privately and not served to browsers, so you don't needproductionBrowserSourceMaps. - Sets up a tunnel route. Ad blockers often block requests to Sentry's domain, which silently drops client errors.
tunnelRoutesends events through a route on your own domain instead.
If you use proxy.ts with a broad matcher, exclude the tunnel route (/monitoring here) so your proxy doesn't intercept or block Sentry's requests.
Store SENTRY_AUTH_TOKEN as a CI secret. It's needed only at build time and should never be in a NEXT_PUBLIC_ variable.
Error Boundaries and Sentry
onRequestError catches errors on the server. But when a Client Component throws during rendering in the browser, React handles it in the nearest error boundary, and the error never reaches the global handlers. Report it from the boundary itself.
The root-level boundary is app/global-error.tsx, which replaces the whole document when the root layout fails:
// app/global-error.tsx
"use client";

import * as Sentry from "@sentry/nextjs";
import { useEffect } from "react";

export default function GlobalError({
  error,
  retry,
}: {
  error: Error & { digest?: string };
  retry: () => void;
}) {
  useEffect(() => {
    Sentry.captureException(error);
  }, [error]);

  return (
    <html lang="en">
      <body>
        <h1>Something went wrong</h1>
        <p>Our team has been notified.</p>
        {error.digest && <p>Reference: {error.digest}</p>}
        <button onClick={() => retry()}>Try again</button>
      </body>
    </html>
  );
}
Do the same in any segment-level error.tsx files. Showing the digest to users gives support a reference they can search in Sentry. In Next.js 16.3, error boundaries receive a retry function, which re-fetches and re-renders the segment; the older reset is still available when you only want to clear the error state. More on error boundaries in custom error boundaries with error.tsx and global-error.tsx.
Errors thrown inside Server Components during rendering are reported once on the server via onRequestError. On the client you'll see the same error arrive at the boundary with its message replaced (to avoid leaking server details) and the digest attached. Sentry can link the two by that digest.
Adding Context to Errors
A stack trace tells you what broke. Context tells you for whom and under what conditions. Add user and request details where you have them:
// lib/monitoring.ts
import * as Sentry from "@sentry/nextjs";

export function identifyUser(user: { id: string; plan: string }) {
  Sentry.setUser({ id: user.id });
  Sentry.setTag("plan", user.plan);
}
Call it after you resolve the session in a layout or Server Action. Use an internal ID rather than an email address unless you've decided to send PII and your privacy policy says so.
For errors you catch and handle yourself, report them explicitly so they don't disappear:
// app/api/checkout/route.ts
import * as Sentry from "@sentry/nextjs";

export async function POST(request: Request) {
  const body = await request.json();

  try {
    const res = await fetch("https://payments.example.com/charge", {
      method: "POST",
      headers: { "Content-Type": "application/json" },
      body: JSON.stringify(body),
    });

    if (!res.ok) {
      throw new Error(`Payment provider responded ${res.status}`);
    }

    return Response.json(await res.json());
  } catch (error) {
    Sentry.captureException(error, {
      tags: { area: "checkout" },
      extra: { cartSize: body.items?.length ?? 0 },
    });
    return Response.json({ error: "Payment failed" }, { status: 502 });
  }
}
This handler returns a clean 502 to the client and still reports the failure, tagged so you can filter checkout issues in one click.
Don't Report Expected Errors
Validation failures, 404s from notFound(), and redirects aren't bugs. notFound() and redirect() work by throwing special errors that Next.js handles internally, and Sentry's integration ignores them. For your own expected errors (a form with invalid input), return an error state from the Server Action instead of throwing. Your error tracker should be full of problems, not noise.
Tracing with OpenTelemetry
Error tracking answers "what broke". Tracing answers "why is it slow". OpenTelemetry (OTel) is the vendor-neutral standard: you instrument once and send data to any compatible backend, whether that's Grafana Tempo, Honeycomb, Datadog, New Relic, Jaeger, or Sentry itself.
Next.js is already instrumented with OTel internally. Once you register a tracer, you get spans for:
- The incoming request (
GET /blog/[slug]), with method, route, and status code. - Rendering the App Router route.
- Every
fetchmade during rendering, with URL and method. - Route Handler execution.
generateMetadatacalls.
Setting NEXT_OTEL_VERBOSE=1 adds more detailed internal spans. Setting NEXT_OTEL_FETCH_DISABLED=1 turns off the built-in fetch spans if you use a separate HTTP instrumentation library.
Registering a Tracer with @vercel/otel
The simplest setup is the @vercel/otel package, which works on any host (not just Vercel) and in both Node.js and Edge runtimes:
npm install @vercel/otel @opentelemetry/api @opentelemetry/sdk-logs @opentelemetry/api-logs @opentelemetry/instrumentation
// instrumentation.ts
import { registerOTel } from "@vercel/otel";

export function register() {
  registerOTel({ serviceName: "storefront-web" });
}
That's it for the code. Where traces go is configured with the standard OTel environment variables, so the same build can export to different backends per environment:
# .env.production
OTEL_EXPORTER_OTLP_ENDPOINT=https://otel-collector.internal:4318
OTEL_EXPORTER_OTLP_HEADERS=x-api-key=your-backend-key
Running a Collector
For self-hosted apps, a common pattern is to send traces to an OpenTelemetry Collector running next to your app, which then forwards them to your backend. The app only knows about the collector, so changing vendors means changing collector config, not code.
# compose.yaml
services:
  web:
    build: .
    environment:
      OTEL_EXPORTER_OTLP_ENDPOINT: http://otel-collector:4318
    ports:
      - "3000:3000"

  otel-collector:
    image: otel/opentelemetry-collector-contrib:latest
    volumes:
      - ./otel-collector.yaml:/etc/otelcol-contrib/config.yaml:ro
    ports:
      - "4318:4318"
# otel-collector.yaml
receivers:
  otlp:
    protocols:
      http:
        endpoint: 0.0.0.0:4318

processors:
  batch:

exporters:
  debug:
    verbosity: basic
  otlphttp:
    endpoint: https://your-tracing-backend.example.com

service:
  pipelines:
    traces:
      receivers: [otlp]
      processors: [batch]
      exporters: [debug, otlphttp]
The debug exporter prints spans to the collector's logs, which is handy while you confirm everything works. Remove it once traces show up in your backend. Pin the collector image to a specific version in production rather than latest.
Custom Spans
Built-in spans show that a page took 900 ms to render. Custom spans show which of your functions took 700 of those milliseconds. Use the @opentelemetry/api package to wrap work you care about:
// lib/products.ts
import { trace, SpanStatusCode } from "@opentelemetry/api";

const tracer = trace.getTracer("storefront");

export type Product = { id: string; name: string; price: number };

export async function getRecommendations(userId: string): Promise<Product[]> {
  return tracer.startActiveSpan("getRecommendations", async (span) => {
    span.setAttribute("app.user_id", userId);
    try {
      const res = await fetch(`https://recs.internal/api/users/${userId}`);
      const products: Product[] = await res.json();
      span.setAttribute("app.recommendations.count", products.length);
      return products;
    } catch (error) {
      span.recordException(error as Error);
      span.setStatus({ code: SpanStatusCode.ERROR });
      throw error;
    } finally {
      span.end();
    }
  });
}
startActiveSpan makes the new span the parent of anything created inside it, so the automatic fetch span nests under getRecommendations in your trace view. Always call span.end() in finally, or the span is never exported. Attributes let you filter and group traces later, for example finding every slow request for users with large carts.
If no tracer is registered, @opentelemetry/api falls back to a no-op implementation, so this code is safe to ship even in environments where tracing is turned off.
Using Sentry and OpenTelemetry Together
Recent versions of the Sentry Node.js SDK are built on OpenTelemetry. When you call Sentry.init on the server, Sentry registers its own OTel tracer provider. That has two consequences:
- If Sentry is your tracing backend, you don't need
@vercel/otelat all. Next.js's built-in spans and any custom spans you create with@opentelemetry/api(likegetRecommendationsabove) appear in Sentry's performance view automatically. - If you want traces in another backend (Tempo, Honeycomb, Datadog) and only errors in Sentry, don't register two global tracer providers. Either set Sentry's
tracesSampleRateto0and keep Sentry for errors only, or follow Sentry's guide for using the SDK with an existing OpenTelemetry setup, which uses theskipOpenTelemetrySetupoption and adds Sentry's span processor to your own provider.
Pick one owner for tracing and stick with it. Two competing setups lead to duplicated or missing spans, and that's harder to debug than either alone.
Correlating Logs with Traces
Logs are much more useful when you can jump from a log line straight to the trace it belongs to. Include the active trace ID in every structured log:
// lib/logger.ts
import { trace } from "@opentelemetry/api";

type Level = "debug" | "info" | "warn" | "error";

export function log(
  level: Level,
  message: string,
  fields: Record<string, unknown> = {},
) {
  const spanContext = trace.getActiveSpan()?.spanContext();

  console.log(
    JSON.stringify({
      level,
      message,
      time: new Date().toISOString(),
      trace_id: spanContext?.traceId,
      span_id: spanContext?.spanId,
      ...fields,
    }),
  );
}
// app/actions/orders.ts
"use server";

import { log } from "@/lib/logger";

export async function cancelOrder(orderId: string) {
  log("info", "Cancelling order", { orderId });
  // ...cancel logic
}
Most log platforms can link trace_id to your tracing backend, so a single error log takes you to the full request timeline.
Client-Side Performance
Server traces don't tell you how fast the page felt to the user. For that, measure Core Web Vitals in the browser. Sentry's browser SDK reports them when tracing is enabled. If you're not using Sentry on the client, Next.js's useReportWebVitals hook can send the metrics anywhere; see measuring real user performance with useReportWebVitals.
Keeping Volume and Cost Under Control
Monitoring can get expensive quickly on a busy site. A few habits keep it manageable:
- Sample traces, not errors. A
tracesSampleRateof 0.05 to 0.2 is plenty for most production apps. UsetracesSamplerto sample important routes (checkout) higher and noisy ones (health checks) at zero. - Filter noise before it's sent. Sentry's
ignoreErrorsandbeforeSendoptions can drop known browser-extension errors and third-party script failures. - Scrub sensitive data. Leave
sendDefaultPiioff unless you need it, and strip tokens or personal fields inbeforeSend. The same goes for span attributes: don't record emails, passwords, or full request bodies. - Tag releases. Set
releaseto your git SHA so you can see which deploy introduced an error and mark issues as resolved "in the next release". - Alert on trends, not single events. Alert on a spike in error rate or a regression in p95 latency for key routes. Alerting on every error trains your team to ignore alerts.
Conclusion
Next.js gives you three hooks for observability: register() and onRequestError() in instrumentation.ts for the server, and instrumentation-client.ts for the browser. Sentry plugs into all three to capture server, edge, and client errors with readable stack traces, while error boundaries report the rendering errors React catches. OpenTelemetry, registered with @vercel/otel or through Sentry's own OTel-based SDK, turns each request into a trace with built-in spans for rendering and fetches, plus the custom spans you add around your own code. Choose one owner for tracing, include trace IDs in your logs, sample sensibly, and you'll know about problems in production before your users have to tell you.