Profiling Python Code with cProfile and timeit
When a Python program is slow, the instinct is to start rewriting whatever looks expensive: the regex, the nested loop, the JSON parsing. Most of the time that instinct is wrong. The slow part is somewhere you didn't expect, and the code you "optimized" was never the problem.
The fix is to measure before you change anything. Python's standard library ships two tools for this, and they answer different questions:
cProfileanswers where the time goes in a whole program: which functions are called, how often, and how long they take.timeitanswers how fast one small piece of code is, accurately enough to compare two versions.
This post shows how to use both on a realistic example: run cProfile to find a hotspot, read its output correctly, dig into the results with pstats, and then use timeit to confirm that a fix actually helps. Everything here is in the standard library and works on Python 3.13.
The Example Program
Here's a small log-analysis script. It generates 200,000 fake JSON log lines (standing in for reading a file), parses them, finds slow requests, and counts unique users.
# report.py
import json
import random
import re


def make_log(n: int) -> list[str]:
    random.seed(42)
    users = [f"user{i}" for i in range(5_000)]
    paths = ["/", "/blog", "/about", "/pricing", "/docs"]
    return [
        json.dumps(
            {
                "user": random.choice(users),
                "path": random.choice(paths),
                "ms": random.randint(5, 900),
            }
        )
        for _ in range(n)
    ]


def parse(lines: list[str]) -> list[dict]:
    return [json.loads(line) for line in lines]


def is_valid_user(name: str) -> bool:
    return re.match(r"^user\d+$", name) is not None


def slow_requests(records: list[dict]) -> list[dict]:
    return [r for r in records if r["ms"] > 500 and is_valid_user(r["user"])]


def unique_users(records: list[dict]) -> list[str]:
    seen: list[str] = []
    for r in records:
        if r["user"] not in seen:
            seen.append(r["user"])
    return seen


def main() -> None:
    lines = make_log(200_000)
    records = parse(lines)
    slow = slow_requests(records)
    users = unique_users(records)
    print(f"{len(slow)} slow requests, {len(users)} unique users")


if __name__ == "__main__":
    main()
It takes a bit over five seconds to run. Before reading on, guess which function is the slow one. JSON parsing 200,000 lines? The regex? Let's find out.
Running cProfile from the Command Line
The quickest way to profile a script is to run it through the cProfile module. No code changes needed:
python -m cProfile -s cumulative report.py
-s sets the sort order. Here's the top of the output:
89044 slow requests, 5000 unique users
         7931404 function calls (7931256 primitive calls) in 6.634 seconds

   Ordered by: cumulative time

   ncalls  tottime  percall  cumtime  percall filename:lineno(function)
      7/1    0.000    0.000    6.634    6.634 {built-in method builtins.exec}
        1    0.019    0.019    6.634    6.634 report.py:1(<module>)
        1    0.000    0.000    6.612    6.612 report.py:43(main)
        1    4.703    4.703    4.704    4.704 report.py:35(unique_users)
        1    0.148    0.148    1.307    1.307 report.py:7(make_log)
        1    0.036    0.036    0.499    0.499 report.py:23(parse)
   200000    0.085    0.000    0.463    0.000 __init__.py:299(loads)
   400000    0.163    0.000    0.448    0.000 random.py:345(choice)
   200000    0.049    0.000    0.426    0.000 __init__.py:183(dumps)
   ...
        1    0.019    0.019    0.101    0.101 report.py:31(slow_requests)
The answer is unique_users: 4.7 of the 6.6 seconds. JSON parsing takes half a second and the regex-based filter takes a tenth of a second. Neither would have been worth touching.
Notice the total is 6.6 seconds under the profiler, versus about 5.3 seconds normally. Profiling adds overhead to every function call, which is why function-call-heavy code (like make_log, with its millions of random calls) looks relatively more expensive under the profiler than it really is. Treat the numbers as relative, not absolute.
Reading the Columns
Each row is one function. The columns mean:
| Column | Meaning |
|---|---|
ncalls | Number of calls. 7/1 means 7 total calls, 1 of them primitive (not recursive). |
tottime | Time spent in the function itself, excluding functions it called. |
percall (first) | tottime / ncalls. |
cumtime | Time spent in the function including everything it called. |
percall (second) | cumtime / primitive calls. |
filename:lineno(function) | Where the function is defined. Built-ins appear in braces. |
The distinction between tottime and cumtime is the key to reading a profile:
- High
cumtime, lowtottimemeans the function is a coordinator. The cost is in something it calls.mainandmake_loglook like this; follow the chain down. - High
tottimemeans the work happens right there in that function's own code.unique_usershas atottimeof 4.7 seconds out of 4.7 cumulative. The cost is the loop itself, not anything it calls.
Why is the loop so slow? r["user"] not in seen checks membership in a list, which scans it element by element. With 5,000 unique users and 200,000 records, that's hundreds of millions of comparisons. Membership tests on a set or dict are constant time on average. The fix is obvious once you know where to look, and we'll measure it with timeit shortly.
Useful Sort Keys
-s accepts several keys. The ones you'll use most:
cumulative(orcumtime): find which high-level step is expensivetottime: find where the actual work happensncalls(orcalls): find functions called suspiciously oftenfilename,name: group output by location
Sorting by tottime on the same script puts the culprit right at the top:
python -m cProfile -s tottime report.py
   Ordered by: internal time

   ncalls  tottime  percall  cumtime  percall filename:lineno(function)
        1    4.760    4.760    4.761    4.761 report.py:35(unique_users)
   600000    0.210    0.000    0.324    0.000 random.py:245(_randbelow_with_getrandbits)
   200000    0.191    0.000    0.191    0.000 encoder.py:205(iterencode)
   400000    0.161    0.000    0.444    0.000 random.py:345(choice)
        1    0.146    0.146    1.290    1.290 report.py:7(make_log)
You can also profile a module instead of a script with python -m cProfile -m package.module.
Saving and Analyzing Results with pstats
For anything bigger than a toy script, the printed output is too long to scan. Save the raw data to a file with -o:
python -m cProfile -o report.prof report.py
Then load it with the pstats module, where you can sort, filter, and trim the output:
# show_stats.py
import pstats

stats = pstats.Stats("report.prof")
stats.strip_dirs().sort_stats("cumulative").print_stats(8)
Sat Oct  3 17:33:10 2026    report.prof

         7931404 function calls (7931256 primitive calls) in 6.638 seconds

   Ordered by: cumulative time
   List reduced from 224 to 8 due to restriction <8>

   ncalls  tottime  percall  cumtime  percall filename:lineno(function)
      7/1    0.000    0.000    6.638    6.638 {built-in method builtins.exec}
        1    0.019    0.019    6.638    6.638 report.py:1(<module>)
        1    0.000    0.000    6.614    6.614 report.py:43(main)
        1    4.712    4.712    4.713    4.713 report.py:35(unique_users)
        1    0.147    0.147    1.308    1.308 report.py:7(make_log)
        1    0.035    0.035    0.492    0.492 report.py:23(parse)
   200000    0.084    0.000    0.456    0.000 __init__.py:299(loads)
   400000    0.163    0.000    0.446    0.000 random.py:345(choice)
What each call does:
strip_dirs()removes long directory paths from file names so rows fit on screen.sort_stats()takes the same keys as-s. You can pass several to break ties.print_stats()takes restrictions: an integer limits the number of rows, a float between 0 and 1 keeps that fraction, and a string is treated as a regex that filters by function name or file. For example,print_stats("report.py")shows only your own code.
Who Called What
When a library function shows up high in the list, you usually want to know which of your functions is calling it. print_callers() answers that, and print_callees() goes the other direction:
import pstats

stats = pstats.Stats("report.prof").strip_dirs()
stats.sort_stats("tottime").print_callers("choice")
   Ordered by: internal time
   List reduced from 224 to 1 due to restriction <'choice'>

Function               was called by...
                           ncalls  tottime  cumtime
random.py:345(choice)  <-  400000    0.163    0.446  report.py:7(make_log)
All 400,000 calls to random.choice come from make_log. In a large codebase where a hot helper is called from a dozen places, this is how you find the one that matters.
You can also run python -m pstats report.prof for an interactive browser with commands like sort cumtime and stats 10.
Visualizing Profiles
Text tables get hard to read for deep call trees. Third-party viewers can load the same .prof file:
- SnakeViz (
pip install snakeviz, thensnakeviz report.prof) opens an interactive sunburst or icicle chart in your browser. - gprof2dot turns the profile into a call graph image via Graphviz.
These don't change what's measured. They just make it easier to see where the big blocks of time are.
Profiling Part of a Program
Often you don't want to profile the whole program, only one step: a single request handler, one phase of a pipeline. cProfile.Profile works as a context manager:
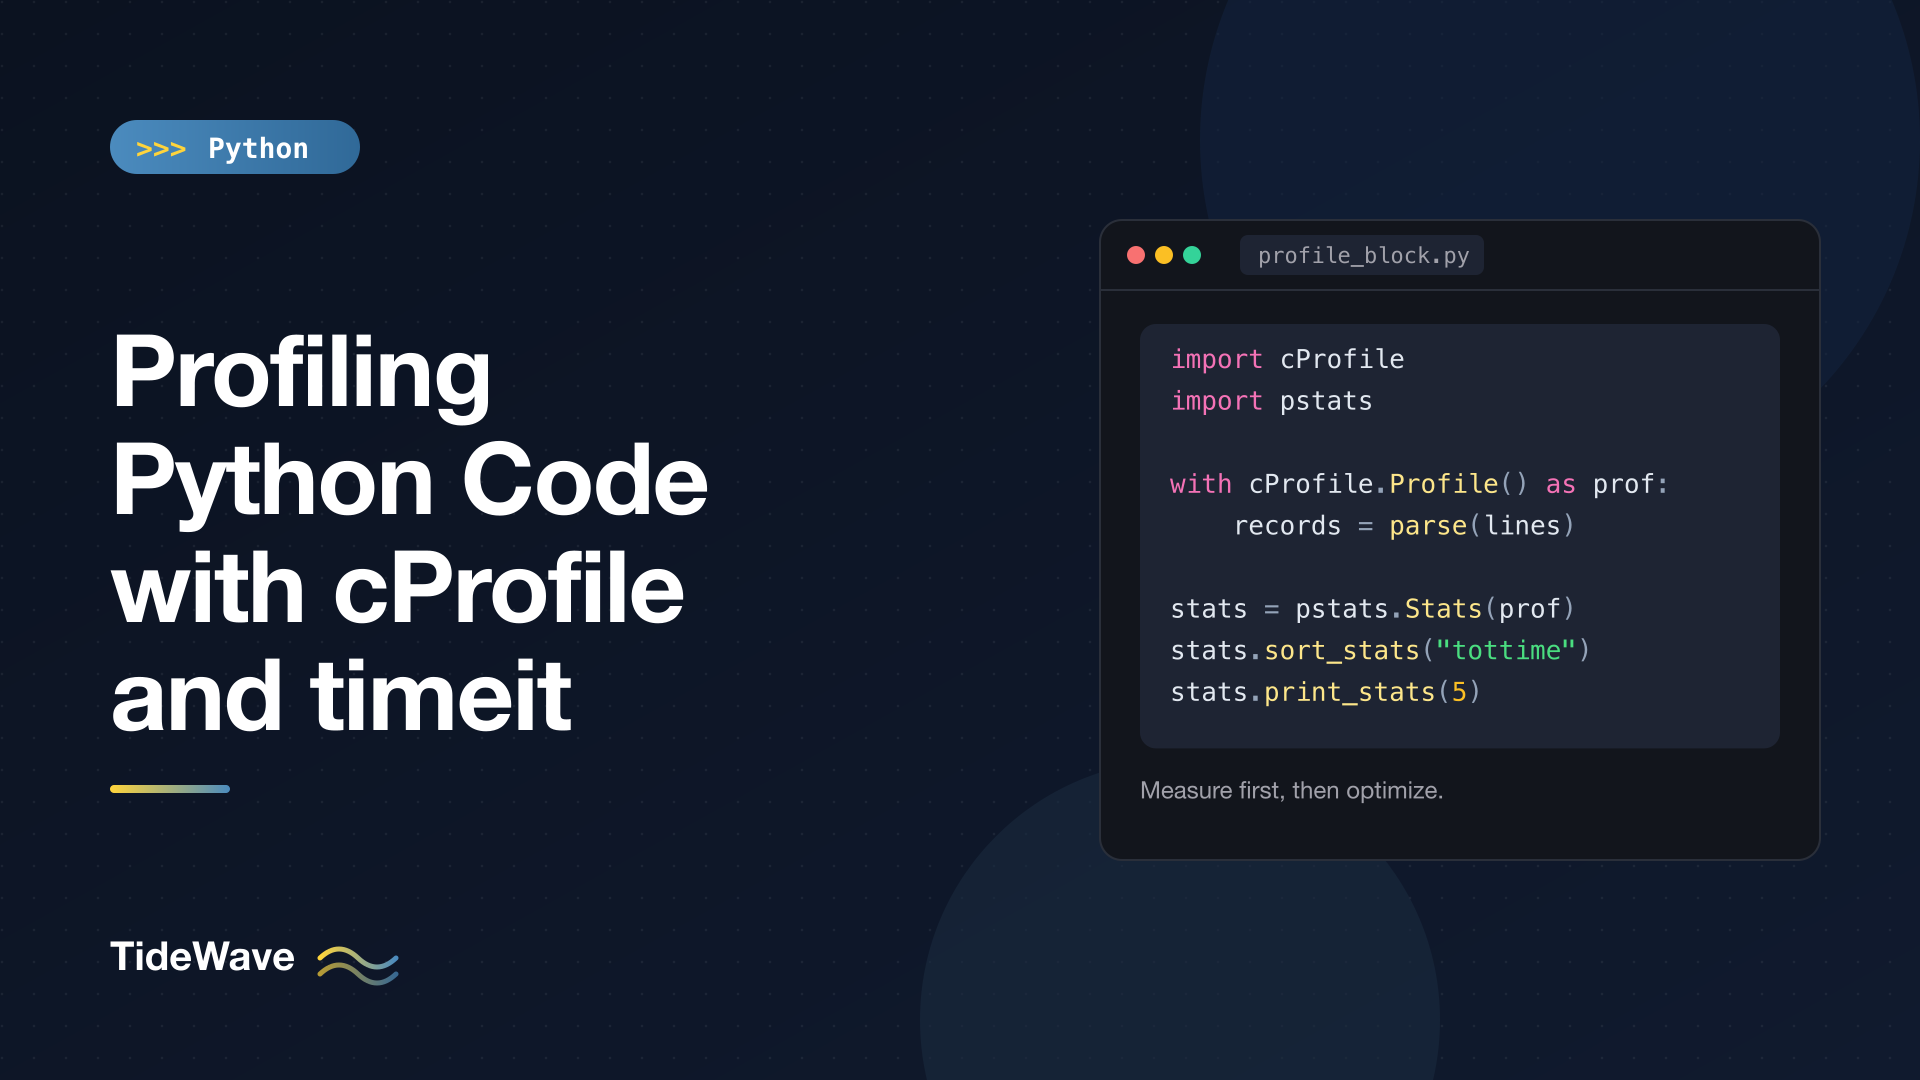
# profile_block.py
import cProfile
import pstats

from report import make_log, parse, slow_requests

lines = make_log(200_000)  # not profiled

with cProfile.Profile() as profiler:
    records = parse(lines)
    slow = slow_requests(records)

stats = pstats.Stats(profiler).strip_dirs().sort_stats("tottime")
stats.print_stats(5)
         2445402 function calls (2445398 primitive calls) in 0.602 seconds

   Ordered by: internal time
   List reduced from 56 to 5 due to restriction <5>

   ncalls  tottime  percall  cumtime  percall filename:lineno(function)
   200000    0.146    0.000    0.346    0.000 decoder.py:340(decode)
   200000    0.094    0.000    0.094    0.000 decoder.py:351(raw_decode)
   200000    0.085    0.000    0.462    0.000 __init__.py:299(loads)
   489044    0.077    0.000    0.077    0.000 {method 'match' of 're.Pattern' objects}
        1    0.036    0.036    0.498    0.498 report.py:23(parse)
Only the code inside the with block is recorded. You can also call profiler.enable() and profiler.disable() manually, and profiler.dump_stats("file.prof") to save the results for later.
Measuring with timeit
Once the profiler has pointed you at a hotspot, you need a reliable way to compare the current code against a candidate fix. Timing with time.perf_counter() around a single call is noisy: CPU frequency scaling, other processes, and caches all add variation. timeit handles this by running the code many times, repeating that measurement several times, and reporting the best result.
timeit from the Command Line
For quick one-liners, the command-line interface is the fastest way to answer "which is faster?":
python -m timeit '"-".join(str(n) for n in range(100))'
python -m timeit '"-".join([str(n) for n in range(100)])'
python -m timeit '"-".join(map(str, range(100)))'
50000 loops, best of 5: 6.43 usec per loop
50000 loops, best of 5: 5.32 usec per loop
50000 loops, best of 5: 5.05 usec per loop
timeit picks the number of loops automatically so that each measurement takes at least 0.2 seconds, repeats that five times, and reports the best. The best is used because slower runs are slowed by noise, not by your code.
Use -s for setup code that shouldn't be timed:
python -m timeit -s 'data = list(range(10_000))' '9_999 in data'
python -m timeit -s 'data = set(range(10_000))' '9_999 in data'
5000 loops, best of 5: 54.4 usec per loop
20000000 loops, best of 5: 17.2 nsec per loop
That's the same bug as unique_users, isolated: a list membership test for an element near the end is about 3,000 times slower than a set lookup.
The other flags you're likely to use:
-n N: run the statement exactly N times per measurement-r N: repeat the measurement N times (default 5)-u UNIT: force the unit (nsec,usec,msec,sec)-p: measure CPU time withtime.process_time()instead of wall-clock time
timeit from Python
When the code you want to measure is a function in your project, use the module API. timeit.timeit() runs a statement number times and returns the total seconds. timeit.repeat() does that several times and returns a list. Both accept callables as well as strings.
Here's the fix for unique_users, checked for correctness and then compared against the original:
# compare_unique.py
import timeit

from report import make_log, parse, unique_users


def unique_users_fast(records: list[dict]) -> list[str]:
    return list(dict.fromkeys(r["user"] for r in records))


records = parse(make_log(200_000))
assert unique_users(records) == unique_users_fast(records)

for func in (unique_users, unique_users_fast):
    times = timeit.repeat(lambda: func(records), number=1, repeat=3)
    print(f"{func.__name__:<18} best of 3: {min(times):.4f}s")
unique_users       best of 3: 4.6973s
unique_users_fast  best of 3: 0.0128s
dict.fromkeys() removes duplicates while keeping first-seen order, which matches the original behavior, and uses hash lookups instead of list scans. The function went from 4.7 seconds to 13 milliseconds. Note the assert: always confirm that the faster version returns the same result before you trust the timing.
A few details about the API:
- Pass
globals=globals()when timing a string that refers to names in your module, for exampletimeit.timeit("squares(1_000)", globals=globals(), number=10_000). Without it, the statement runs in an empty namespace and fails withNameError. timeit.Timer(stmt, setup).autorange()returns(number, total_time)using the same automatic loop count as the command line.timeittemporarily disables the garbage collector during timing so that collection pauses don't skew results. If your code's real-world performance depends on GC behavior, addgc.enable()to the setup.
timeit in Jupyter and IPython
In IPython and Jupyter notebooks, the %timeit magic wraps the same module with a friendlier output, and %%timeit times a whole cell. The same advice applies: put setup in a separate cell so it isn't measured.
A Profiling Workflow That Works
Putting it together, a reliable process looks like this:
- Reproduce the slowness with realistic input. Profiling a 10-row test file tells you nothing about a 10-million-row production file.
- Profile the whole program with
python -m cProfile -o out.prof, then sort bycumulativeto find the expensive step and bytottimeto find where the work happens. - Isolate the hotspot and write a
timeitcomparison of the current version against your candidate fix, with anassertthat they produce the same result. - Apply the fix and re-profile. The next bottleneck often moves somewhere new.
- Stop when it's fast enough. In our example, after the fix, the remaining time is dominated by data generation and JSON parsing, which is fine.
For a collection of common fixes once you've found the hotspot, see Speeding Up Python Code: Practical Optimization Techniques.
Limits of cProfile and Other Tools
cProfile is a deterministic profiler: it records every function call and return. That's precise about call counts but has two weaknesses:
- Overhead. Code with many tiny function calls is slowed more, which distorts the relative costs. That's why our
make_loglooked heavier under the profiler. - Function granularity. It tells you which function is slow, not which line. If a 200-line function is the hotspot, you have to narrow it down yourself.
When those matter, there are third-party tools worth knowing:
- line_profiler times individual lines inside functions you decorate with
@profile. - py-spy is a sampling profiler that attaches to a running process without modifying it, with very low overhead. Good for production or long-running services.
- Scalene samples CPU and memory usage and separates time spent in Python from time in native code.
For memory rather than speed, the standard library's tracemalloc is the place to start; Memory Management and Garbage Collection in Python covers it.
Conclusion
Measure first, then optimize. cProfile shows you where a program spends its time: sort by cumulative to find the expensive step and by tottime to find the function doing the actual work, and use pstats to filter large profiles and trace callers. timeit then tells you, reliably, whether a change is actually faster, as long as you keep setup out of the measurement and check that both versions return the same result.
In the example, the culprit wasn't the JSON parsing or the regex anyone would have guessed. It was a list used for membership checks, and a one-line fix made that step over 300 times faster. The profiler found it in one run.