Debugging Next.js Applications in VS Code and Chrome DevTools
A Next.js app runs in two places at once. Server Components, Server Actions, Route Handlers, and proxy.ts execute in a Node.js process. Client Components execute in the browser, after first being rendered on the server too. That split is what makes Next.js debugging confusing at first: you put a console.log in a component, and it shows up in the terminal instead of the browser console, or in both, or in neither because the code never ran where you expected.
The fix is to stop guessing and use a real debugger on each side. With breakpoints you can pause execution, inspect variables and the call stack, and step through code line by line, on the server and in the browser.
This guide covers debugging a Next.js 16 app with VS Code and Chrome DevTools: launch configurations for server, client, and full-stack debugging, attaching Chrome DevTools to the Node.js server, debugging Server Actions and Route Handlers, inspecting RSC network requests, using React DevTools, and tracking down errors that only happen in production builds.
Know Where Your Code Runs
Before you set a breakpoint, you need to know which debugger will hit it.
| Code | Runs on | Debug with |
|---|---|---|
Server Component (no "use client") | Server only | Node.js debugger |
Server Action ("use server") | Server only | Node.js debugger |
Route Handler (route.ts) | Server only | Node.js debugger |
proxy.ts | Server | Node.js debugger |
| Client Component, initial render | Server, then browser | Both |
| Client Component, event handlers and effects | Browser only | Browser debugger |
generateMetadata, generateStaticParams | Server (often at build time) | Node.js debugger |
The row that trips people up is the Client Component. Its render function runs on the server to produce HTML, then again in the browser during hydration. useEffect callbacks and event handlers like onClick only ever run in the browser. If you're unsure which components are which, the practical mental model for React Server Components is a good refresher.
A quick check: logs from server code appear in the terminal running next dev. In development, React also replays Server Component logs in the browser console, marked with a "Server" label, so seeing a log in the browser doesn't by itself prove the code ran there.
Debugging with VS Code
VS Code's built-in JavaScript debugger can debug both the Node.js server and the browser. All you need is a launch configuration.
The Launch Configuration
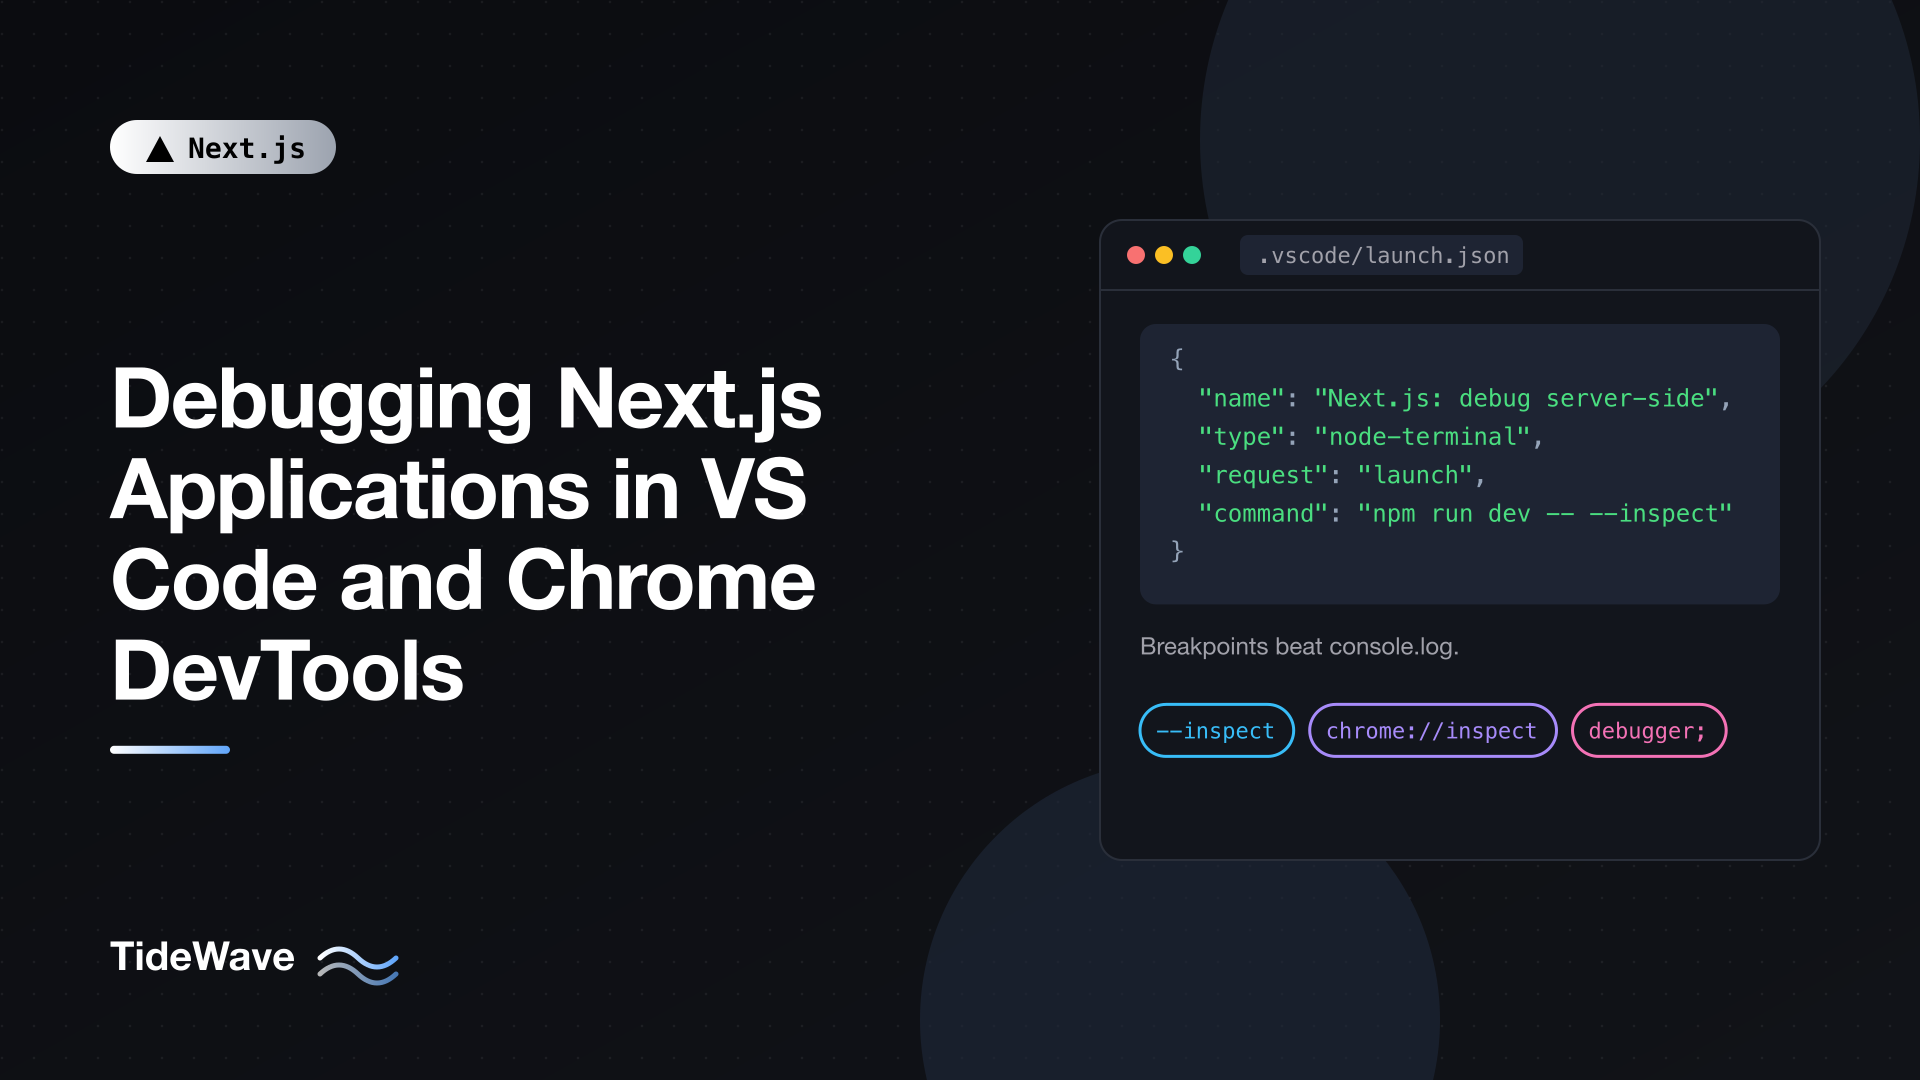
Create .vscode/launch.json at the root of your project:
{
  "version": "0.2.0",
  "configurations": [
    {
      "name": "Next.js: debug server-side",
      "type": "node-terminal",
      "request": "launch",
      "command": "npm run dev -- --inspect"
    },
    {
      "name": "Next.js: debug client-side",
      "type": "chrome",
      "request": "launch",
      "url": "http://localhost:3000"
    },
    {
      "name": "Next.js: debug full stack",
      "type": "node",
      "request": "launch",
      "program": "${workspaceFolder}/node_modules/next/dist/bin/next",
      "runtimeArgs": ["--inspect"],
      "skipFiles": ["<node_internals>/**"],
      "serverReadyAction": {
        "action": "debugWithChrome",
        "killOnServerStop": true,
        "pattern": "- Local:.+(https?://.+)",
        "uriFormat": "%s",
        "webRoot": "${workspaceFolder}"
      }
    }
  ]
}
These are the configurations from the official Next.js debugging guide, with the full-stack option set to launch Chrome.
- debug server-side runs
npm run dev -- --inspectin a VS Code terminal and attaches the debugger to the Node.js process. Breakpoints in Server Components, Server Actions, Route Handlers, andproxy.tswork here. - debug client-side launches a separate Chrome instance pointing at your app (start
npm run devyourself first). Breakpoints in event handlers and effects work here. - debug full stack starts the Next.js dev server under the debugger, waits for the "Local:" line in the output, then opens Chrome with the client debugger attached. One session covers both sides. Use
debugWithEdgeinstead if you use Edge.
A few adjustments you might need:
- If you use pnpm or Yarn, change the command to
pnpm dev --inspectoryarn dev --inspect. - If your app runs on a different port, update
http://localhost:3000. - In a monorepo (for example with Turborepo), add
"cwd": "${workspaceFolder}/apps/web"to the server-side and full-stack configurations so Next.js starts in the right directory.
Open the Run and Debug panel (Ctrl+Shift+D on Windows/Linux, Cmd+Shift+D on macOS), pick a configuration, and press F5.
Setting Breakpoints
Click in the gutter to the left of a line number to add a breakpoint, shown as a red dot. Take this Server Component:
// app/products/[id]/page.tsx
import { notFound } from "next/navigation";
import { getProduct } from "@/lib/products";

export default async function ProductPage({
  params,
}: {
  params: Promise<{ id: string }>;
}) {
  const { id } = await params;
  const product = await getProduct(id);

  if (!product) notFound();

  return (
    <main>
      <h1>{product.name}</h1>
      <p>{product.description}</p>
    </main>
  );
}
Put a breakpoint on the if (!product) line, start the server-side configuration, and load /products/123 in the browser. Execution pauses, and VS Code shows:
- Variables:
id,product, and everything else in scope. - Watch: expressions you want to evaluate at every pause, like
product?.price * 1.2. - Call Stack: how you got here, which is helpful when a data function is called from several places.
- Debug Console: a REPL in the paused scope, where you can run
product.variants.lengthor call helpers.
Use F10 to step over, F11 to step into a function, Shift+F11 to step out, and F5 to continue.
Conditional Breakpoints and Logpoints
Pausing on every request gets old quickly. Right-click a breakpoint and choose Edit Breakpoint to add:
- A condition, like
id === "123", so the breakpoint only triggers for one product. - A hit count, to pause on the Nth time a line runs.
- A log message (a logpoint), like
Loaded product {product.name}, which prints to the Debug Console without pausing. Logpoints areconsole.logwithout editing your source, so there's nothing to forget to remove before you commit.
The JavaScript Debug Terminal
If you don't want to maintain launch.json, open the Command Palette and run Debug: JavaScript Debug Terminal. Any Node.js process started from that terminal, including npm run dev, has the debugger attached automatically. It's the fastest way to debug server code once in a while.
Debugging Server Actions
Server Actions are a common source of "it just doesn't work" bugs, because the call starts in the browser but the code runs on the server. Set breakpoints in the action file and use the server-side debugger:
// app/posts/actions.ts
"use server";

import { revalidatePath } from "next/cache";
import { db } from "@/lib/db";

export async function publishPost(id: string) {
  const post = await db.post.findUnique({ where: { id } });
  if (!post) return { error: "Post not found" };

  await db.post.update({ where: { id }, data: { published: true } });
  revalidatePath("/posts");
  return { ok: true };
}
A breakpoint on the if (!post) line pauses when someone clicks the button that calls publishPost. You can inspect the id the client actually sent, which is often where the bug is (an undefined value, a number where you expected a string).
The dev server also logs each Server Function call in the terminal by default, with its name, arguments, and duration:
POST /posts
  └─ ƒ publishPost("abc123") in 18ms app/posts/actions.ts
That log alone often answers "was the action called, and with what?" before you reach for a breakpoint. You can turn it off with logging.serverFunctions: false in next.config.ts.
Debugging with Chrome DevTools
You don't need VS Code to use a real debugger. Chrome DevTools can debug both the browser and the Node.js server.
Client-Side Code
Run npm run dev, open http://localhost:3000, and open DevTools (Ctrl+Shift+J on Windows/Linux, Cmd+Option+I on macOS). Then:
- Go to the Sources panel.
- Press
Ctrl+P/Cmd+Pand type the name of your file, for examplelike-button.tsx. Source maps are enabled in development, so you see your original TypeScript, not compiled output. - Click a line number to set a breakpoint, then interact with the page.
You can also pause from code with a debugger statement:
// components/like-button.tsx
"use client";

import { useState } from "react";

export function LikeButton({ postId }: { postId: string }) {
  const [liked, setLiked] = useState(false);

  async function toggle() {
    debugger; // pauses here when DevTools is open
    const res = await fetch(`/api/posts/${postId}/like`, { method: "POST" });
    if (res.ok) setLiked((l) => !l);
  }

  return (
    <button aria-pressed={liked} onClick={toggle}>
      {liked ? "Liked" : "Like"}
    </button>
  );
}
debugger does nothing when DevTools is closed, but remove it before committing anyway. A lint rule (no-debugger) catches stragglers.
Other DevTools breakpoint types are especially handy in React apps:
- Event listener breakpoints (Sources panel sidebar): pause on any
clickorsubmit, useful when you don't know which handler fires. - DOM change breakpoints: right-click an element in the Elements panel and choose Break on > subtree modifications to find what code is changing it.
- XHR/fetch breakpoints: pause when a request URL contains a given string.
- Pause on exceptions: the pause icon in the Breakpoints section stops at the exact line that throws, before an error boundary catches it.
Server-Side Code
To debug the Node.js server in Chrome DevTools, start the dev server with the inspector enabled:
npm run dev -- --inspect
The terminal prints something like:
Debugger listening on ws://127.0.0.1:9229/0cf90313-350d-4466-a748-cd60f4e47c95
For help, see: https://nodejs.org/learn/getting-started/debugging
Then:
- Open a new tab and go to
chrome://inspect. - Find your Next.js app under Remote Target and click inspect.
- A dedicated DevTools window opens. Use its Sources panel and
Cmd+P/Ctrl+Pto find server files and set breakpoints.
Breakpoints in Server Components, actions, and Route Handlers now pause in that window when you load a page.
A few variations:
- To pause before any code runs (useful for debugging startup or config loading), use
NODE_OPTIONS=--inspect-brk next dev. The--inspect-brkand--inspect-waitflags must go throughNODE_OPTIONS, not as anext devargument. - When running inside Docker, use
--inspect=0.0.0.0and expose port 9229 so you can attach from the host.
Jumping from the Error Overlay to the Server
When a server error appears in the dev overlay, Next.js shows a Node.js icon near the version indicator. Clicking it copies the DevTools URL for the server process to your clipboard. Paste it into a new tab to inspect the server directly, without hunting through chrome://inspect.
Inspecting RSC Requests in the Network Panel
Client-side navigations in the App Router don't fetch HTML. They fetch an RSC payload, a serialized description of the Server Component tree for the new route. When a navigation shows stale data or the wrong content, the Network panel tells you what the server actually sent.
In the Network panel, look for:
- Navigation requests with an
_rscquery parameter and anRSC: 1request header. The response has atext/x-componentcontent type. Open the Response tab to see the payload, which contains your rendered props and text in a readable (if dense) format. - Prefetch requests, which fire when
Linkcomponents enter the viewport. If you see data in a page before clicking, it probably came from a prefetch. - Server Action calls, which are
POSTrequests to the current page URL with aNext-Actionheader. The request body contains the serialized arguments; the response contains the return value and any updated RSC payload.
Filtering the Network panel by _rsc or by the Fetch/XHR type cuts through the noise. If a navigation returns correct data but the page still looks stale, the problem is on the client (state that wasn't reset, a component that didn't re-render). If the payload itself is stale, look at server-side caching.
React DevTools
Install the React Developer Tools browser extension. It adds two panels:
- Components: the React tree, with props, state, hooks, and context for each component. You can edit props and state live to test edge cases. Server Components appear in the tree too, marked as such, so you can see where the server-client boundary sits.
- Profiler: records renders while you interact with the page, showing which components rendered, why, and how long each took. It's the right tool for "typing in this input is slow" problems.
Turn on Highlight updates when components render in the Components panel settings to see re-renders flash on the page. Unnecessary re-renders of large subtrees are easy to spot this way.
Forwarding Browser Logs to the Terminal
If you'd rather see everything in one place, Next.js can forward browser console output to the terminal during development:
// next.config.ts
import type { NextConfig } from "next";

const nextConfig: NextConfig = {
  logging: {
    browserToTerminal: true,
  },
};

export default nextConfig;
true forwards all console output; "warn" (the default) forwards warnings and errors; "error" forwards only errors. Each forwarded log includes the source file and line. This is useful when an AI coding agent or a teammate is reading your terminal output, and for catching client errors you'd otherwise miss because DevTools was closed.
Debugging Production-Only Problems
Some bugs only appear after next build: prerender failures, differences in caching, minified stack traces you can't read.
Prerender errors during the build. Rerun with:
next build --debug-prerender
This disables server minification, turns on server source maps, and continues past the first failure, so the stack trace points at your source file and line, and you see all failing routes in one run. Never deploy a build made with this flag.
Minified errors in the browser. Production builds don't ship browser source maps by default. To debug a production build locally, enable them temporarily:
// next.config.ts
import type { NextConfig } from "next";

const nextConfig: NextConfig = {
  productionBrowserSourceMaps: true,
};

export default nextConfig;
Then run next build && next start and debug in Chrome DevTools as usual. This makes your source readable to anyone who opens DevTools, so think before enabling it on a public deployment. Error tracking services can upload source maps privately instead.
Debugging next start. The production server can be inspected too: NODE_OPTIONS=--inspect next start and then chrome://inspect. Breakpoints in minified server code are hard to use, which is another reason --debug-prerender exists for build-time problems.
Verbose build output. next build --debug prints extra information such as rewrites, redirects, and headers, which helps when a route behaves differently in production than you expect.
A Debugging Checklist
When something goes wrong and you're not sure where to start:
- Read the full error. The dev overlay and terminal show the source location and, for many errors, a link to a docs page with fixes. The common Next.js errors guide covers the frequent ones.
- Decide where the code runs. Server, browser, or both? That decides which debugger to use.
- Check the terminal. Server errors, Server Function calls, and fetch logs appear there.
- Check the Network panel. Did the request happen? With what payload? What came back?
- Set a breakpoint, not a log. Pause where the data first looks wrong and walk back up the call stack.
- Reproduce in a production build if the bug doesn't appear in development.
Conclusion
Debugging a Next.js app gets much easier once you match each piece of code to the environment it runs in. Use the VS Code full-stack launch configuration to cover both sides in one session, or next dev --inspect with chrome://inspect if you prefer DevTools. Set breakpoints in Server Components and Server Actions on the server side, in event handlers and effects on the client side, and use the Network panel to see RSC payloads and action calls. For build-only failures, next build --debug-prerender gives you readable stack traces.
The time you spend setting up launch.json once pays for itself the first time you can pause inside a Server Action and see exactly what the client sent.