Measuring Test Coverage in Python with coverage.py
A green test suite tells you that the tests you wrote pass. It doesn't tell you what you didn't write tests for. That untested error branch, the country code nobody tried, the else that only runs on the first of the month: they all sit quietly until production finds them. Coverage measurement closes that gap by recording which lines and branches actually ran during your tests.
coverage.py is the standard tool for this in Python, and pytest-cov is the thin plugin that wires it into pytest. This guide shows how to run both, how to read their reports (including branch coverage, which catches things line coverage misses), how to configure them in pyproject.toml, how to exclude code deliberately, and how to enforce a minimum in CI. Just as important, it covers what a coverage number does and doesn't tell you.
How Coverage Works
While your tests run, coverage.py hooks into the interpreter and records every line that executes in the files you care about. Afterward, it compares that record with the set of executable lines in each file (found by analyzing the source) and reports the difference.
The mechanism depends on your Python version. Traditionally coverage.py used a C-based trace function. On Python 3.12 and later it can use sys.monitoring (PEP 669), a low-overhead monitoring API built for tools like this, and on Python 3.14 that's the default. You don't need to choose: coverage.py picks the best option automatically. On 3.13 you can opt in with COVERAGE_CORE=sysmon for line coverage, but branch measurement through sys.monitoring needs 3.14, so coverage.py falls back to the C tracer when branch coverage is on.
Installing
Install both tools as development dependencies:
python -m pip install coverage pytest-cov
You don't strictly need pytest-cov; coverage.py works on its own with any test runner. But if you use pytest, the plugin is convenient, and we'll look at both.
A Module to Measure
Here's a small shipping-cost module with several decisions in it:
# src/pricing/shipping.py
FREE_SHIPPING_THRESHOLD = 50.0


def shipping_cost(subtotal: float, country: str, express: bool = False) -> float:
    if subtotal < 0:
        raise ValueError("subtotal cannot be negative")

    if country == "US":
        cost = 5.0
    elif country in {"CA", "MX"}:
        cost = 12.0
    else:
        cost = 25.0

    if express:
        cost *= 2

    if subtotal >= FREE_SHIPPING_THRESHOLD and not express:
        cost = 0.0

    return cost


def describe(cost: float) -> str:
    if cost == 0:
        return "Free shipping"
    return f"Shipping: ${cost:.2f}"


def with_insurance(cost: float, insured: bool) -> float:
    if insured:
        cost += 3.0
    return cost
And a first pass at tests that look reasonable at a glance:
# tests/test_shipping.py
from pricing.shipping import describe, shipping_cost, with_insurance


def test_domestic_standard():
    assert shipping_cost(20.0, "US") == 5.0


def test_free_shipping_over_threshold():
    assert shipping_cost(80.0, "US") == 0.0


def test_international_express():
    assert shipping_cost(20.0, "DE", express=True) == 50.0


def test_describe_paid():
    assert describe(12.0) == "Shipping: $12.00"


def test_insurance_adds_fee():
    assert with_insurance(5.0, insured=True) == 8.0
The project uses a src layout with pythonpath = ["src"] under [tool.pytest], as in the pytest beginner's guide.
Running coverage.py
Measurement and reporting are separate steps. First, run your tests under coverage. coverage run takes the place of python, so python -m pytest becomes:
coverage run -m pytest
This runs the tests normally and writes the collected data to a .coverage file in the current directory. (Add it to .gitignore.) Then ask for a report:
coverage report -m
Name                      Stmts   Miss  Cover   Missing
-------------------------------------------------------
src/pricing/__init__.py       0      0   100%
src/pricing/shipping.py      22      3    86%   6, 11, 26
tests/test_shipping.py       11      0   100%
-------------------------------------------------------
TOTAL                        33      3    91%
Here's how to read it:
- Stmts: executable statements in the file.
- Miss: statements that never ran.
- Cover: the percentage that ran.
- Missing (from
-m): the line numbers that never ran. This column is the useful part.
Lines 6, 11, and 26 are the raise ValueError for negative subtotals, the cost = 12.0 for Canada and Mexico, and the "Free shipping" return in describe. Three real behaviors with zero tests. Notice that the test file itself is in the report, padding the total to 91%. We'll fix that with configuration shortly.
Branch Coverage: What Line Coverage Misses
Look at with_insurance. Every one of its lines ran, so line coverage calls it 100% covered. But the tests only ever passed insured=True. The path where the if is false and execution jumps straight to return was never taken.
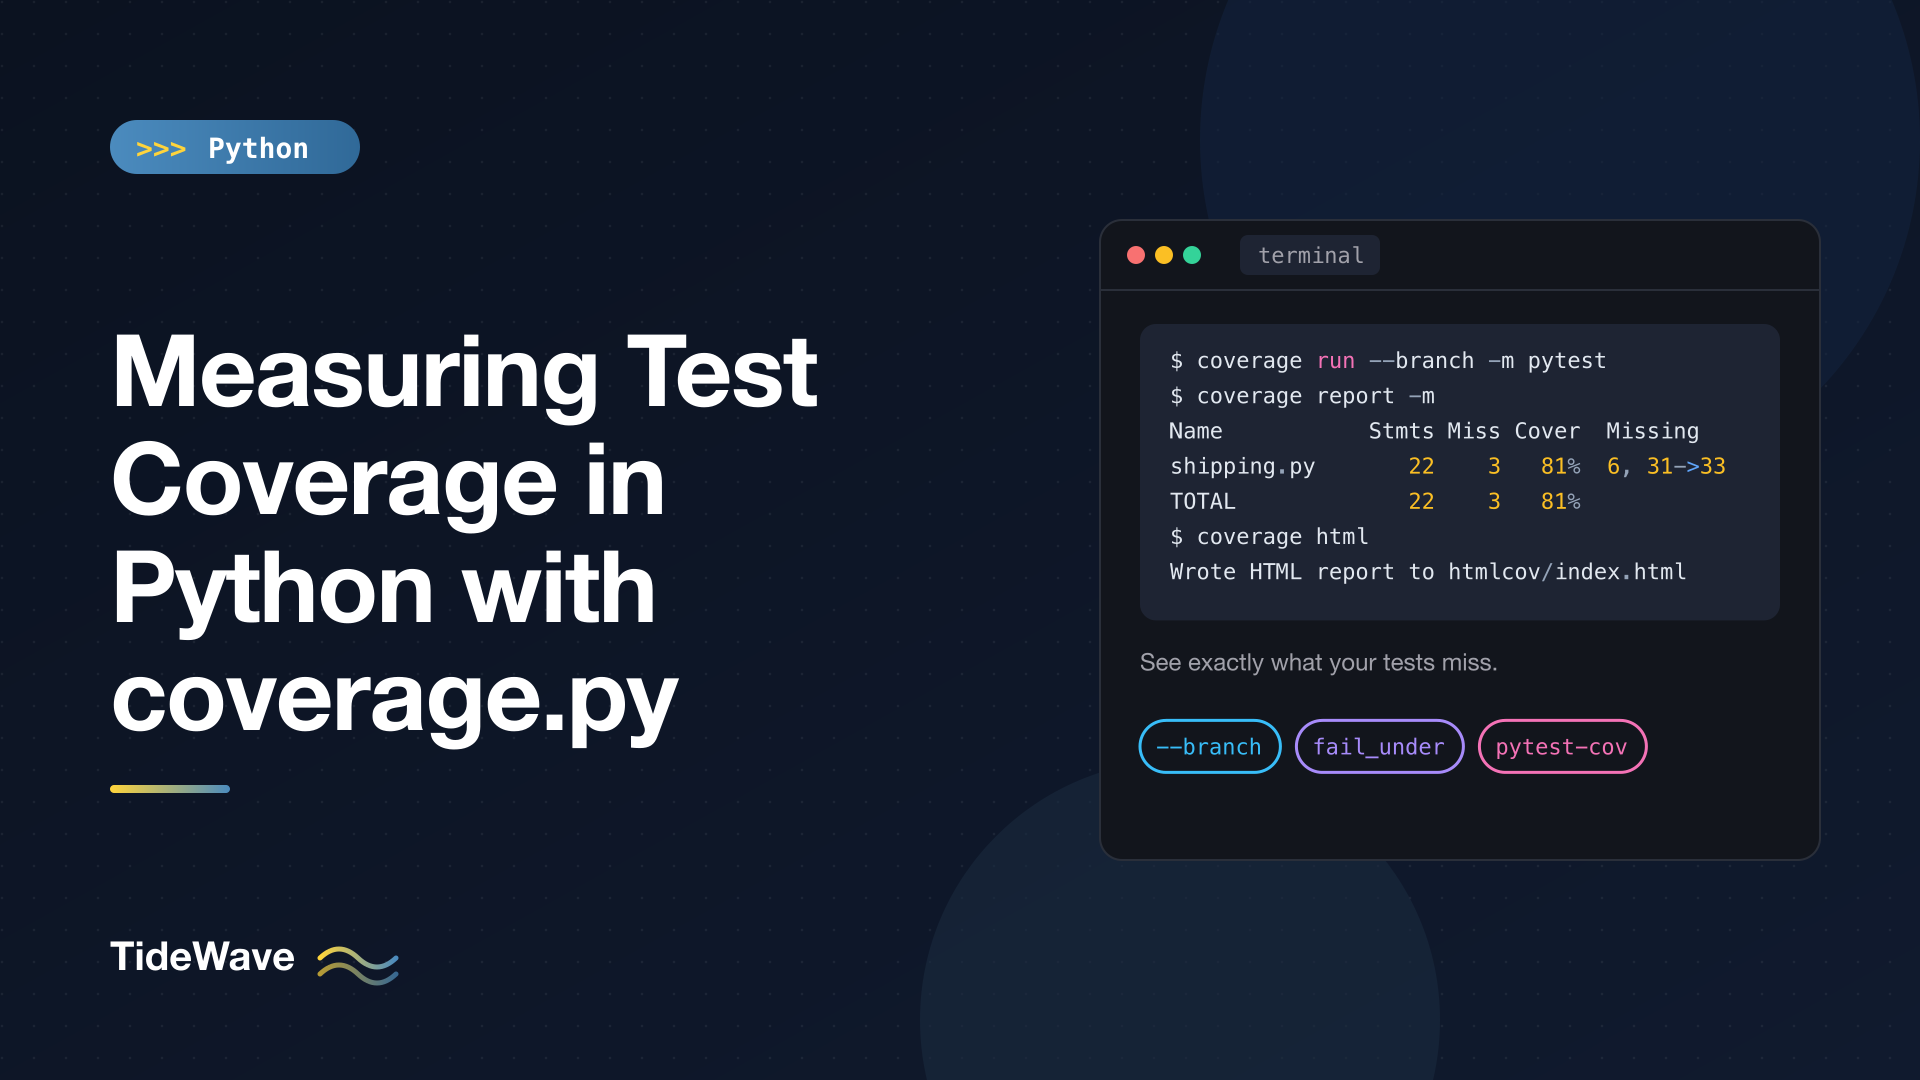
Branch coverage tracks those jumps. Turn it on with --branch:
coverage run --branch -m pytest
coverage report -m --include="src/*"
Name                      Stmts   Miss Branch BrPart  Cover   Missing
---------------------------------------------------------------------
src/pricing/__init__.py       0      0      0      0   100%
src/pricing/shipping.py      22      3     14      4    81%   6, 11, 26, 31->33
---------------------------------------------------------------------
TOTAL                        22      3     14      4    81%
Two new columns appear: Branch is the number of possible branch destinations, and BrPart counts places where at least one destination was never taken. The new entry in Missing, 31->33, means "the jump from line 31 (if insured:) to line 33 (return cost) never happened". That's exactly the untested insured=False case.
The partial branches for lines 6, 11, and 26 are folded into the missing lines themselves, since an unexecuted line implies an untaken branch into it.
Branch coverage is stricter and much more informative than line coverage. Turn it on for every project; there's rarely a reason not to.
The HTML Report
For anything bigger than one file, the terminal report gets hard to navigate. The HTML report shows each source file with executed lines in green, missed lines in red, and partial branches in yellow, with annotations describing which branch was missed:
coverage html
Wrote HTML report to htmlcov/index.html
Open htmlcov/index.html in a browser. The index page lists every file, sortable by coverage, and clicking through shows the annotated source. This is the fastest way to understand why a file's coverage is low, and it's usually where you'll spend your time when writing tests to fill gaps.
Other formats are available for tools and CI services:
coverage xmlwrites Cobertura-style XML, understood by most CI dashboards and code review integrations.coverage jsonwrites machine-readable JSON with per-file and total figures.coverage lcovwrites LCOV format, used by some editors and services.
Configuring coverage.py in pyproject.toml
Passing --branch and --include every time gets old. Put the settings in pyproject.toml:
# pyproject.toml
[tool.coverage.run]
branch = true
source = ["src"]

[tool.coverage.report]
show_missing = true
skip_covered = true
fail_under = 90
exclude_also = [
    "if TYPE_CHECKING:",
    "raise NotImplementedError",
    "if __name__ == .__main__.:",
]

[tool.coverage.html]
directory = "htmlcov"
What each setting does:
branch = trueenables branch coverage for every run.source = ["src"]measures only code undersrc/, so test files don't inflate the total. Importantly, it also reports files undersrcthat were never imported at all, as 0% covered. Withoutsource, a module no test touches simply doesn't appear in the report, which hides the worst gaps. (Usesource_pkgs = ["pricing"]instead if you'd rather name importable packages than directories.)show_missing = trueis the same as always passing-m.skip_covered = truehides fully covered files from the terminal report, so only the files that need attention are listed.fail_under = 90makescoverage reportexit with status 2 if the total is below 90%.exclude_alsoadds regular expressions for lines to exclude from measurement, on top of the default# pragma: no cover. Excluding a line that starts a block (likeif TYPE_CHECKING:) excludes the whole block.
With that config, a plain coverage run -m pytest followed by coverage report gives:
Name                      Stmts   Miss Branch BrPart  Cover   Missing
---------------------------------------------------------------------
src/pricing/shipping.py      22      3     14      4    81%   6, 11, 26, 31->33
---------------------------------------------------------------------
TOTAL                        22      3     14      4    81%

1 file skipped due to complete coverage.
Coverage failure: total of 81 is less than fail-under=90
The empty __init__.py is skipped as fully covered, the test file is gone, and the command fails because we're below the threshold. Set precision = 1 under [tool.coverage.report] if you want decimals in the percentages.
Filling the Gaps
The report is a to-do list. Each missing line or branch is a behavior to test:
# tests/test_shipping_more.py
import pytest

from pricing.shipping import describe, shipping_cost, with_insurance


def test_negative_subtotal_rejected():
    with pytest.raises(ValueError):
        shipping_cost(-1.0, "US")


def test_canada_standard():
    assert shipping_cost(20.0, "CA") == 12.0


def test_describe_free():
    assert describe(0.0) == "Free shipping"


def test_uninsured_cost_unchanged():
    assert with_insurance(5.0, insured=False) == 5.0
Name    Stmts   Miss Branch BrPart  Cover   Missing
---------------------------------------------------
TOTAL      22      0     14      0   100%

2 files skipped due to complete coverage.
Every line and every branch now runs. Notice that each new test checks a real behavior with a real assertion; we didn't just call functions to turn lines green. More on that below.
Excluding Code on Purpose
Some code genuinely shouldn't count: debugging helpers, defensive branches for "impossible" states, platform-specific code that can't run on the CI machine. Mark a line or block with a comment:
def __repr__(self) -> str:  # pragma: no cover
    return f"Order({self.id!r})"
Or exclude patterns project-wide with exclude_also, as in the config above. Common entries include if TYPE_CHECKING: (imports only needed by type checkers), raise NotImplementedError (abstract methods), and @overload stubs.
To leave whole files out of measurement, use omit:
[tool.coverage.run]
omit = ["src/pricing/_vendored/*", "*/migrations/*"]
Use exclusions sparingly and deliberately. Every pragma: no cover is a claim that the code doesn't need a test; make sure that's true and not just inconvenient.
Using pytest-cov
pytest-cov runs coverage.py for you as part of the pytest run, and it reads the same [tool.coverage.*] configuration:
pytest --cov --cov-report=term-missing
.........                                                                [100%]
================================ tests coverage ================================
_______________ coverage: platform darwin, python 3.13.2-final-0 _______________

Name    Stmts   Miss Branch BrPart  Cover   Missing
---------------------------------------------------
TOTAL      22      0     14      0   100%

2 files skipped due to complete coverage.
Required test coverage of 90.0% reached. Total coverage: 100.00%
9 passed in 0.09s
--covwith no value measures thesourcefrom your config. You can also pass a path or package:--cov=src.--cov-reporttakesterm,term-missing,html,xml,json, orlcov, and can be repeated:--cov-report=term-missing --cov-report=xml.--cov-fail-under=90sets the threshold from the command line; it also honorsfail_underfrom your config, which is where the "Required test coverage" line comes from.
pytest-cov also handles some awkward cases for you, such as combining data from pytest-xdist workers when you run tests in parallel with -n auto. To make coverage always part of the test run, add it to pytest's options:
[tool.pytest]
addopts = ["--cov", "--cov-report=term-missing"]
That does slow every run a little, and it interferes with debuggers, so many people keep coverage as a separate CI step instead.
Coverage in CI
A minimal CI step looks like this:
coverage run -m pytest
coverage report          # fails the build if below fail_under
coverage xml             # for your CI's coverage viewer
Because fail_under lives in pyproject.toml, local runs and CI agree on the threshold.
Subprocesses and Parallel Runs
If your tests start Python subprocesses (for example, to test a command-line tool), those processes aren't measured by default. Enable the subprocess patch, and turn on parallel mode so each process writes its own data file:
[tool.coverage.run]
parallel = true
patch = ["subprocess"]
Then merge the data files before reporting:
coverage run -m pytest
coverage combine
coverage report
coverage combine is also how you merge results from several CI jobs, such as a test matrix across Python versions or operating systems. Upload each job's data file as an artifact, download them all into one job, combine, and report. Setting relative_files = true under [tool.coverage.run] keeps paths portable between machines.
What Coverage Doesn't Tell You
A high coverage number is necessary for a well-tested codebase, but nowhere near sufficient. Keep these limits in mind:
- Executed is not verified. A test that calls a function and asserts nothing produces 100% coverage of that function. Coverage measures what ran, not what was checked.
- Branches aren't input combinations.
shipping_costis fully covered, but no test checks express shipping to Canada over the threshold. Combinations, boundaries (what about exactly 50.0?), and unusual values need deliberate thought; property-based testing with Hypothesis is a strong tool for this. - 100% is not the goal. Chasing the last few percent often produces brittle tests for trivial code. Many teams aim for something like 80 to 90% overall, with critical modules close to fully covered.
- The trend matters more than the number. A threshold that prevents coverage from dropping on each pull request does more good than an arbitrary target. Some CI services can report coverage of just the changed lines, which is often the most useful metric of all.
The best use of a coverage report is as a map of what you haven't thought about yet. The red lines are questions: "what should happen when the subtotal is negative?" Answering them with real assertions is what actually makes the code safer.
Conclusion
coverage.py shows you exactly which lines and branches your tests exercise. Run your suite with coverage run -m pytest (or pytest --cov), read the Missing column or the HTML report, and turn each gap into a test that checks real behavior. Configure it once in pyproject.toml with branch = true, a source so untested files show up, and a fail_under threshold, and your local runs and CI will enforce the same standard.
Combined with well-structured tests (see pytest fixtures and parametrization) and mocks for external dependencies, coverage turns "I think this is tested" into something you can actually see.