Profiling React Apps with React DevTools
Most React performance work goes wrong at the first step. Someone notices the app feels slow, guesses which component is to blame, and wraps half the codebase in memo and useCallback. The app is no faster, the code is harder to read, and nobody knows which change mattered.
The fix is to measure before you optimize. The Profiler in React DevTools records every render your app does during an interaction, shows how long each component took, and tells you why it rendered at all. With that data, the slow part is usually obvious within a couple of minutes.
This post walks through installing DevTools, recording a profile, reading the flame graph and ranked charts, finding the cause of a re-render, profiling production builds, and measuring renders in code with the <Profiler> component.
Installing React DevTools
React DevTools is a browser extension for Chrome, Firefox, and Edge. Install it from your browser's extension store, then open your app and the browser's developer tools. You'll see two new tabs: Components and Profiler.
If the tabs don't appear, check that:
- The page is using React (the extension icon lights up when it detects React).
- You've reloaded the page after installing the extension.
- You're not inside a cross-origin iframe, which DevTools can't inspect by default.
For React Native, Safari, or embedded webviews, there's a standalone version:
npx react-devtools
It prints a script tag that you add to your page so the app can connect to the standalone window.
Setting Up a Realistic Test
Profiling in development mode gives you relative timings. Components are slower than in production because React runs extra checks, and Strict Mode renders twice. That's fine for finding which component is the problem, since its share of the total stays roughly the same. For absolute numbers, profile a production build, covered later in this post.
Here's a small app with a typical performance problem to profile:
// App.tsx
import { useState } from "react";

type Product = { id: number; name: string; price: number };

const products: Product[] = Array.from({ length: 3000 }, (_, i) => ({
  id: i,
  name: `Product ${i}`,
  price: Math.round(Math.random() * 10000) / 100,
}));

function ProductRow({ product }: { product: Product }) {
  // Simulate an expensive row
  const start = performance.now();
  while (performance.now() - start < 0.05) {}
  return (
    <li>
      {product.name}: ${product.price.toFixed(2)}
    </li>
  );
}

function ProductList({ items }: { items: Product[] }) {
  return (
    <ul>
      {items.map((p) => (
        <ProductRow key={p.id} product={p} />
      ))}
    </ul>
  );
}

export default function App() {
  const [note, setNote] = useState("");
  return (
    <main>
      <textarea
        value={note}
        onChange={(e) => setNote(e.target.value)}
        placeholder="Write a note"
      />
      <ProductList items={products} />
    </main>
  );
}
Typing in the note field has nothing to do with the products, yet it feels laggy. Let's find out why with data instead of guesses.
Recording a Profile
- Open the Profiler tab.
- Click the gear icon and, under Profiler, enable Record why each component rendered while profiling. This adds the most useful piece of information in the whole tool, so turn it on once and leave it on.
- Click the blue record button.
- Perform the slow interaction. Type a few characters into the textarea.
- Click the record button again to stop.
Keep recordings short and focused on one interaction. A ten-second recording of random clicking produces hundreds of commits and is hard to read.
You can also click the reload-and-profile button to record from the initial page load, which is handy for diagnosing slow startup.
Understanding Commits
The Profiler groups work by commit. Every time React applies changes to the DOM, that's one commit. React's work happens in two phases:
- Render phase: React calls your components and compares the result with the previous output.
- Commit phase: React applies the differences to the DOM and runs layout effects.
The bar chart at the top right of the Profiler shows one bar per commit. Taller, more yellow bars took longer. Click a bar to inspect that commit, or use the arrows to step through them.
In our example, every keystroke creates one commit, and each bar is tall. That already tells you the cost is per keystroke, not a one-off.
Reading the Flame Graph
The Flamegraph view shows the component tree for the selected commit. Each bar is a component:
- Width is how long the component and its children took to render in this commit.
- Color shows its own render time relative to others: yellow is slow, blue-green is fast.
- Gray (or striped) bars did not render in this commit at all.
Click any bar to see details in the right panel: the render duration, how many times it rendered during the recording, and, with the setting from earlier, Why did this render?
In our example, App is at the top, and under it ProductList takes nearly the whole width, followed by 3,000 ProductRow bars. Click ProductList and the reason is: "The parent component rendered." Click App: "Hook 1 changed." That's the textarea's state.
So the chain is clear. Typing changes note, App re-renders, and since ProductList is a child of App, it renders too, even though items hasn't changed.
Reading the Ranked Chart
Switch to the Ranked view to see the same commit as a sorted list, with the slowest components at the top. This is the faster way to answer "what's the single most expensive thing here?" when the tree is deep. In large apps, the culprit is often a component buried ten levels down that's hard to spot in the flame graph.
Why Did This Render?
The reasons DevTools reports map directly to the ways a component can re-render:
- "This is the first time the component rendered." It mounted.
- "Props changed: (items, onSelect)" The listed props got new values. If a prop is a function or object, it may be a new reference with the same content.
- "Hook N changed" A state, reducer, or context hook changed. The number matches the hook's order in the component, and the Components tab shows hook numbers next to each hook so you can match them.
- "Context changed" A context the component reads got a new value.
- "The parent component rendered." Nothing about this component changed. It rendered because its parent did.
The last reason is where most wasted renders come from. If a component renders often because its parent renders, with the same props, it's a candidate for memoization or for moving state down so the parent stops re-rendering.
Fixing the Problem and Verifying It
There are two common fixes for our example. The first is to stop ProductList from re-rendering when its props are the same, using memo:
import { memo } from "react";

const ProductList = memo(function ProductList({ items }: { items: Product[] }) {
  return (
    <ul>
      {items.map((p) => (
        <ProductRow key={p.id} product={p} />
      ))}
    </ul>
  );
});
The second, often better, is to move the state that changes into its own component so the list's parent doesn't re-render at all:
function NoteEditor() {
  const [note, setNote] = useState("");
  return (
    <textarea
      value={note}
      onChange={(e) => setNote(e.target.value)}
      placeholder="Write a note"
    />
  );
}

export default function App() {
  return (
    <main>
      <NoteEditor />
      <ProductList items={products} />
    </main>
  );
}
Now record the same interaction again. The commits for each keystroke should be tiny, and ProductList should show as gray in the flame graph: it didn't render. Always profile again after a change. If the numbers didn't move, revert the change. There's more on when memoization is worth it in Preventing Unnecessary Re-Renders with React.memo and useMemo and useCallback.
If your project uses the React Compiler, many of these fixes happen automatically. Components the compiler optimized show a "Memo" badge in the Components tab.
Highlighting Updates Visually
For a quick, recording-free check, open DevTools settings and, under General, enable Highlight updates when components render. Every time a component renders, it flashes with a colored border on the page.
Type in an input and watch what lights up. If the whole page flashes when you change one field, you've found a render scope that's too broad. It's a rough tool, but it's the quickest way to spot unexpected renders while you click around.
The Timeline Tab
React 18 added a Timeline view to the Profiler for concurrent features. Instead of commits, it shows a time axis with React's scheduling: which updates were urgent, which were transitions, when components suspended, and when long tasks blocked the main thread.
It's useful when you've added useTransition or Suspense and want to verify React is actually interrupting work, or when an interaction feels slow but no single commit is expensive. React 19.2 also added React-specific tracks to the Chrome DevTools Performance panel, so you can see React's scheduler and component work alongside network requests and browser paint in one recording.
Profiling Production Builds
Development builds are slower and include Strict Mode double renders, so absolute numbers are inflated. Production builds are fast but strip out profiling hooks. React ships a third option: a profiling build that is production-optimized but still reports to the Profiler.
With Vite, alias the React DOM client entry to the profiling entry in a production build:
// vite.config.ts
import { defineConfig } from "vite";
import react from "@vitejs/plugin-react";

export default defineConfig(({ mode }) => ({
  plugins: [react()],
  resolve: {
    alias:
      mode === "profile"
        ? { "react-dom/client": "react-dom/profiling" }
        : {},
  },
}));
npx vite build --mode profile
npx vite preview
Open the preview URL and profile as usual. Next.js has a built-in flag for the same thing:
next build --profile
Also test with CPU throttling. In Chrome DevTools, open the Performance panel settings and set CPU to 4x or 6x slowdown. Your laptop is much faster than the average phone, and a 10-millisecond render on your machine can be 60 milliseconds for your users.
Measuring in Code with the Profiler Component
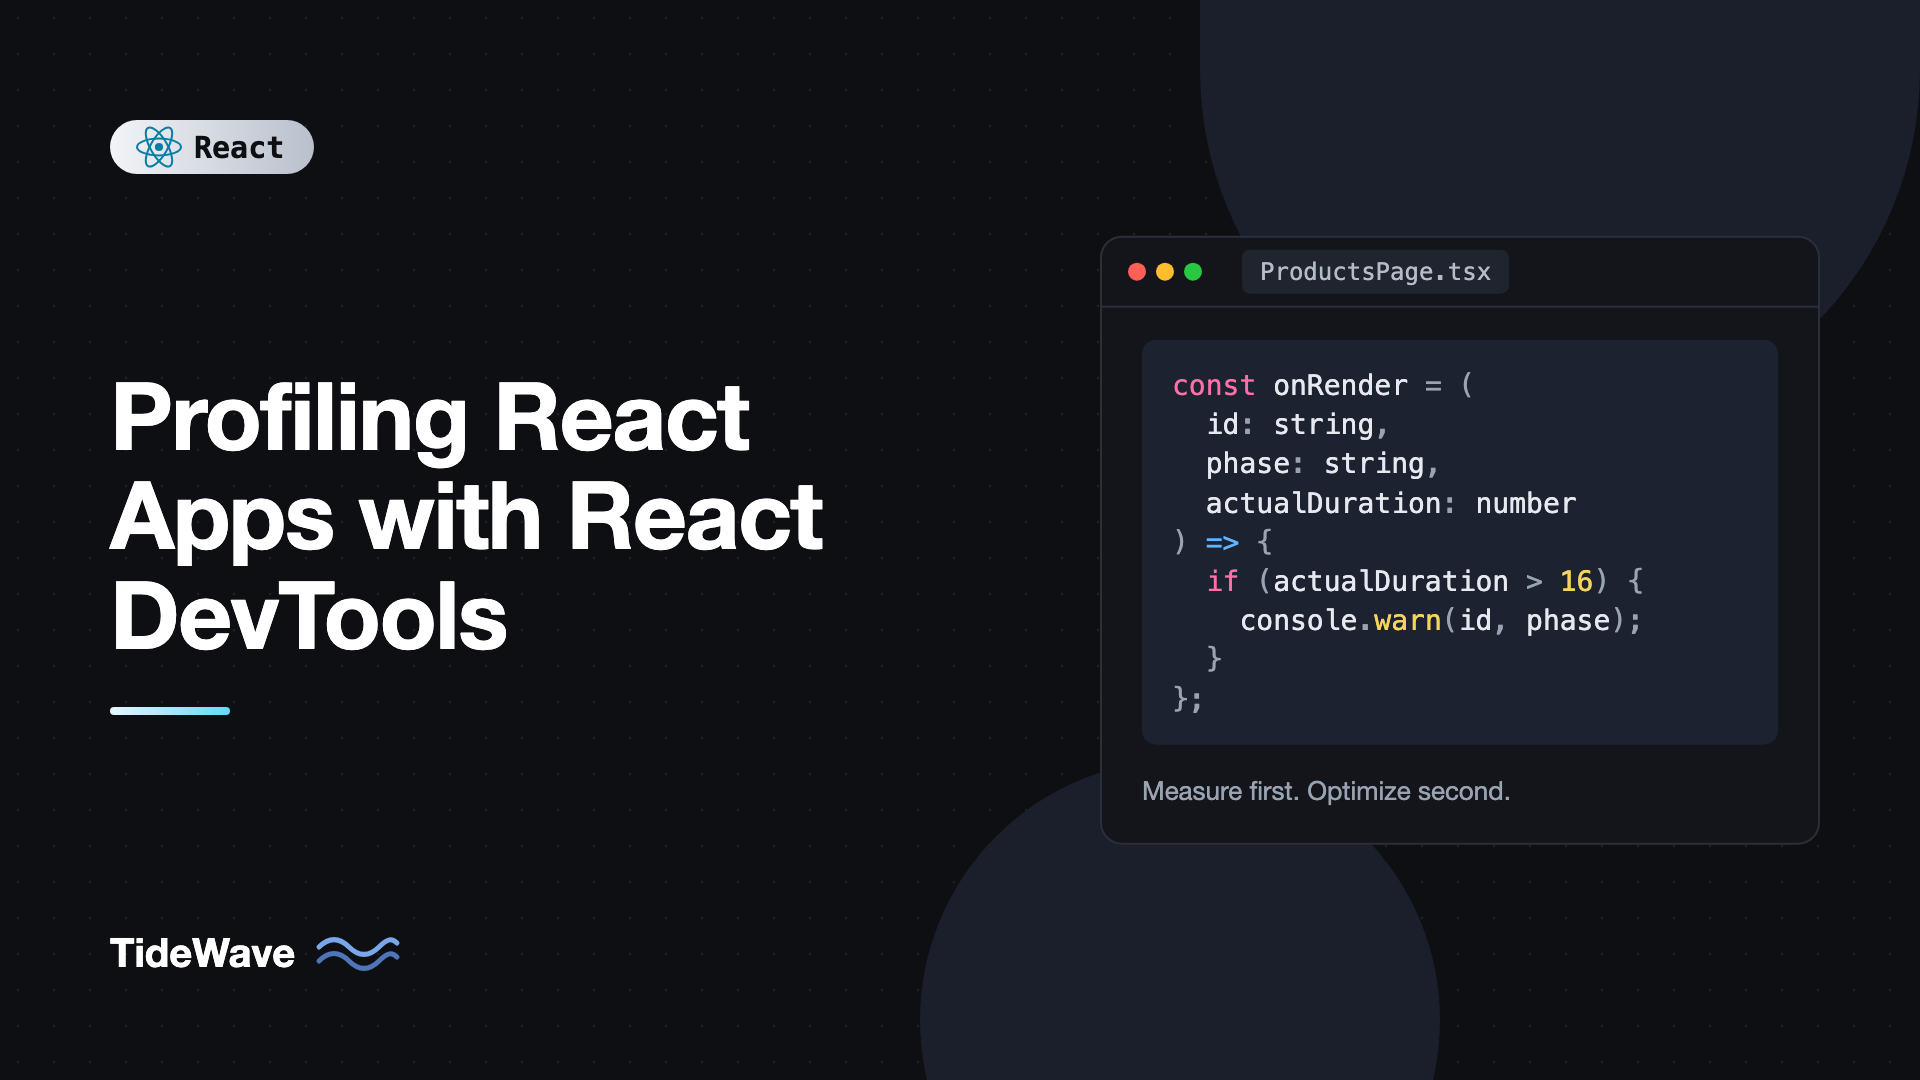
The <Profiler> component measures renders programmatically. It's useful for logging render times in automated tests or sending them to analytics from a profiling build:
import { Profiler, type ProfilerOnRenderCallback } from "react";
import { ProductList } from "./ProductList";
import { products } from "./data";

const onRender: ProfilerOnRenderCallback = (
  id,
  phase,
  actualDuration,
  baseDuration,
  startTime,
  commitTime
) => {
  if (actualDuration > 16) {
    console.warn(
      `[${id}] ${phase} took ${actualDuration.toFixed(1)}ms ` +
        `(no memo: ${baseDuration.toFixed(1)}ms) at ${commitTime.toFixed(0)}`
    );
  }
};

export function ProductsPage() {
  return (
    <Profiler id="ProductList" onRender={onRender}>
      <ProductList items={products} />
    </Profiler>
  );
}
The arguments tell you:
phase:"mount","update", or"nested-update".actualDuration: time spent rendering this subtree in this commit. Memoization lowers it.baseDuration: estimated time to render the whole subtree with no memoization. Compare it withactualDurationto see how much memo is saving.startTimeandcommitTime: timestamps for when React started rendering and when it committed.
<Profiler> is disabled in normal production builds and adds a small overhead, so use it in development or with the profiling build.
Common Mistakes When Profiling React Apps
- Optimizing without recording first. You'll memoize things that were never slow. Record, find the widest yellow bar, fix that, record again.
- Trusting absolute numbers from development builds. Use them for relative comparison only. Use a profiling build for real timings.
- Recording too much. Long sessions with many interactions bury the commit you care about. Record one interaction at a time.
- Ignoring the "why did this render" setting. Without it you see that something rendered but not the cause, which is the part you need to fix.
- Profiling only on a fast machine. Turn on CPU throttling to approximate a mid-range phone.
- Treating every render as a problem. Renders are cheap when components are small. Focus on commits that take longer than a frame (about 16 milliseconds) or that happen on every keystroke.
Frequently Asked Questions (FAQ) About Profiling React Apps
The extension only adds its tabs when it detects React on the page. Reload the page after installing, make sure the app isn't running inside a cross-origin iframe, and check that you're on a page that actually renders React. In a plain production build the Profiler tab appears but recording is disabled, so use a development or profiling build.
The component did not render during that commit. Gray bars are good news when you're hunting wasted renders: after a fix, components that shouldn't be involved in an interaction should show up gray.
Development builds include extra warnings and checks, and Strict Mode renders components twice to catch impure code. Both add time. The relative cost between components stays roughly the same, so development profiling is fine for finding the slowest part, but use a profiling build for real numbers.
Both show the same commit. The flame graph keeps the tree structure so you can see which parent caused children to render. The ranked view sorts components by their own render time, which makes the single most expensive component easy to find in a deep tree.
A frame at 60 frames per second is about 16 milliseconds, and the browser needs part of that for layout and paint. Commits that happen on every keystroke or scroll event should stay well under 16 milliseconds on a throttled CPU. One-off renders, like opening a page, can take longer without users noticing.
The DevTools Profiler is for local investigation. For real-user data, use a profiling build with the Profiler component to log slow commits, or measure Web Vitals such as Interaction to Next Paint with the web-vitals package and send the results to your analytics.
Conclusion
The React DevTools Profiler turns performance work from guessing into measuring. Record a single interaction, step through the commits, use the flame graph and ranked chart to find the expensive components, and read "why did this render" to see the actual cause. Most problems turn out to be one of a few patterns: state placed too high, new object or function props on every render, or a genuinely expensive component that needs memoization.
Make profiling a habit before every optimization. Record, change one thing, record again, and keep the change only if the numbers improved. When you need real timings, switch to a profiling build with CPU throttling on, and use the <Profiler> component when you want to track render cost over time.