Improving Core Web Vitals in a Next.js Application
Core Web Vitals are Google's three measurements of how a page feels to real users: how fast the main content appears, how quickly the page responds to input, and how stable the layout is. They feed into search ranking, but the better reason to care is that they track things users actually notice. A slow LCP is a blank screen. A poor INP is a button that doesn't seem to work. A high CLS is the ad that pushes the "Buy" button down just as you tap it.
Next.js gives you good defaults for all three, but it's still easy to undo them: a hero image fetched in useEffect, a client-side provider wrapping the entire app, a cookie banner that pushes the page down. This post explains what each metric measures, how to find out which one is your problem and why, and the specific Next.js fixes for each. Where a fix deserves its own deep dive, I'll link to it.
The Three Metrics
| Metric | Measures | Good | Needs improvement | Poor |
|---|---|---|---|---|
| LCP (Largest Contentful Paint) | When the largest image or text block in the viewport renders | ≤ 2.5 s | 2.5 to 4 s | > 4 s |
| INP (Interaction to Next Paint) | How long the page takes to visually respond to clicks, taps, and key presses, across the whole visit | ≤ 200 ms | 200 to 500 ms | > 500 ms |
| CLS (Cumulative Layout Shift) | How much visible content moves unexpectedly | ≤ 0.1 | 0.1 to 0.25 | > 0.25 |
Two details that matter when reading these numbers:
- They're assessed at the 75th percentile of real page loads. Your fast laptop on office Wi-Fi isn't the user that matters; the mid-range Android phone on a train is.
- INP replaced First Input Delay (FID) as a Core Web Vital in 2024. INP is much harder to pass because it measures every interaction, not just the first one, and includes the time to actually paint the result.
Step 1: Find Out Which Metric Is the Problem
Don't start optimizing blind. There are two kinds of data, and you need both.
Field data comes from real users. It's what Google uses and what you're graded on.
- PageSpeed Insights shows Chrome User Experience Report (CrUX) data for your URL and origin, if you have enough traffic.
- Google Search Console's Core Web Vitals report groups your URLs by status and metric.
- Your own monitoring, using Next.js's
useReportWebVitalshook to send metrics to an analytics endpoint. That gets its own guide: measuring real user performance with useReportWebVitals.
Lab data comes from a controlled test. It's what you use to debug and verify fixes.
- Lighthouse (in Chrome DevTools or PageSpeed Insights) for LCP and CLS. Lighthouse can't measure INP, because it doesn't interact with the page; it reports Total Blocking Time (TBT) as a proxy.
- The DevTools Performance panel, which shows live LCP, CLS, and INP values as you interact with the page, and highlights the LCP element and shifted elements.
Always test a production build (next build then next start), never next dev. Development mode skips optimizations and adds tooling overhead, so its numbers are meaningless for this. And throttle the CPU and network in DevTools; your machine is much faster than your median user's.
Once you know which metric fails and on which page templates, you can work on the cause.
Fixing LCP
LCP can be broken into four parts, and each has different fixes:
- Time to First Byte (TTFB): how long until the HTML starts arriving.
- Resource load delay: the gap between TTFB and when the browser starts downloading the LCP resource (usually an image).
- Resource load duration: how long that download takes.
- Element render delay: the time between the resource finishing and the element actually painting.
The DevTools Performance panel shows this breakdown for the LCP element. Look at which part is biggest.
Slow TTFB: Render Less at Request Time
If your HTML takes a second to arrive, nothing else matters. In the App Router, the main causes are pages that render dynamically when they don't need to, and data fetching waterfalls.
- Prerender what you can. Pages that don't read cookies, headers, or search params can be generated at build time and served from a CDN. With Cache Components and
"use cache", even pages with some dynamic parts get a static shell that's sent immediately, with the dynamic parts streamed in. - Avoid waterfalls. Three sequential 200ms queries are 600ms of TTFB. Start independent requests together with
Promise.all, or move them into separate components with their own Suspense boundaries. See fetching data in parallel vs sequentially. - Stream slow parts. Wrap slow, below-the-fold sections in
Suspenseso they don't hold up the content that contains the LCP element. - Host near your data. A server in Virginia talking to a database in Frankfurt pays a cross-Atlantic round trip per query.
Load Delay: Let the Browser Find the LCP Image Early
The browser can only start downloading the LCP image once it knows about it. The most common LCP mistake in React apps is making the LCP element depend on client-side JavaScript:
// app/page.tsx - slow: the hero only exists after JS runs and fetch completes
"use client";

import { useEffect, useState } from "react";

export default function Home() {
  const [hero, setHero] = useState<{ imageUrl: string; title: string } | null>(
    null,
  );

  useEffect(() => {
    fetch("/api/hero")
      .then((r) => r.json())
      .then(setHero);
  }, []);

  if (!hero) return <div className="h-[60vh] animate-pulse bg-gray-200" />;
  return <img src={hero.imageUrl} alt={hero.title} />;
}
The browser has to download your JavaScript, hydrate, run the effect, wait for the API, and only then discover the image. Move the fetch to the server and the image is in the initial HTML:
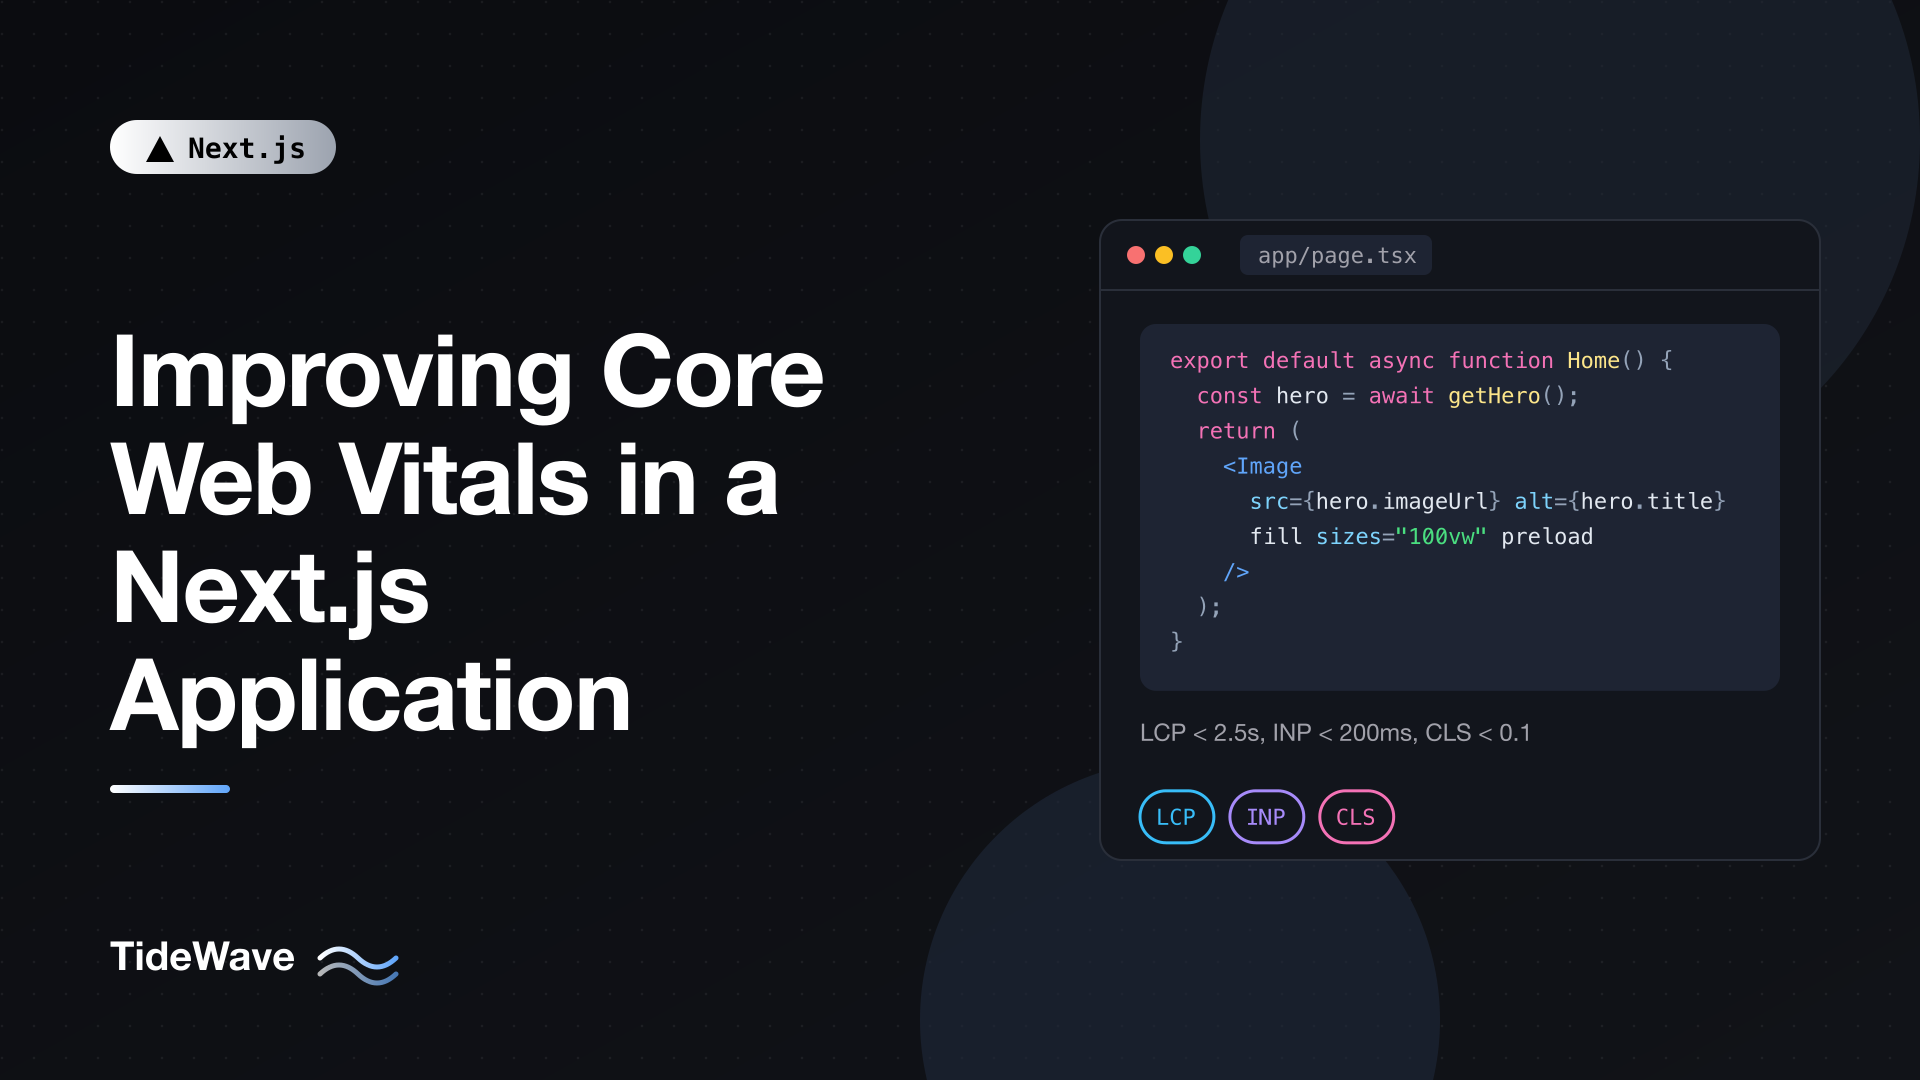
// app/page.tsx - fast: the hero is in the HTML and preloaded
import Image from "next/image";
import { getHero } from "@/lib/content";

export default async function Home() {
  const hero = await getHero();

  return (
    <section className="relative h-[60vh]">
      <Image
        src={hero.imageUrl}
        alt={hero.title}
        fill
        sizes="100vw"
        className="object-cover"
        preload
      />
    </section>
  );
}
getHero stands for whatever reads your content (a database query, a CMS client); the point is that it runs on the server. The preload prop adds a preload link to the document head so the download starts as soon as the HTML arrives. Other load-delay culprits:
- Lazy loading the LCP image.
next/imagelazy loads by default. For the hero, usepreload,loading="eager", orfetchPriority="high". - CSS background images. The browser only discovers these after downloading and parsing the CSS. Use an
Imagewithfillinstead. - Carousels that render slides with JavaScript after hydration. Render the first slide on the server.
Load Duration: Send Fewer Bytes
Once the download starts, make it small. Give responsive images an accurate sizes attribute so phones don't download desktop-sized files, and let next/image serve WebP or AVIF. Everything you need is in optimizing images with next/image.
If your LCP element is text (common on blogs and docs), the "resource" is the web font. Self-host and preload it with next/font.
Render Delay: Don't Hide Content Behind JavaScript
The image is downloaded, but the element still doesn't paint. Usual causes:
- Entrance animations. A hero with
initial={{ opacity: 0 }}from an animation library stays invisible until JavaScript loads, hydrates, and runs the animation. For LCP purposes, the content doesn't exist until then. Don't animate the LCP element in from zero opacity; animate secondary elements instead, or use CSS animations that don't wait for hydration. - Render-blocking scripts. Third-party scripts loaded early compete for the main thread. Use
next/scriptwithafterInteractiveorlazyOnload. - Client-only rendering. Anything rendered with
next/dynamicandssr: false, or gated behind a "mounted" check, can't paint until hydration. Keep the LCP element server-rendered.
Fixing INP
INP measures the delay from a user's interaction to the next frame painted. It has three parts: input delay (the main thread was busy when the user clicked), processing time (your event handlers and the resulting React render), and presentation delay (layout and paint). Almost all INP problems come down to too much JavaScript running on the main thread.
To find the slow interactions, record a Performance profile in DevTools while clicking around, and look at the Interactions track. Long tasks (over 50ms) are flagged with red corners. Click one to see which functions ran.
Ship Less JavaScript
Less code to download, parse, and hydrate means a less busy main thread, especially during page load, when users start tapping.
- Keep components on the server. Server Components send HTML, not JavaScript. Push
"use client"down to the smallest interactive leaf: the "Add to cart" button, not the whole product page. See the use client directive explained. - Lazy load heavy client components that aren't needed immediately, like modals, editors, and charts, with next/dynamic.
- Audit your bundles to find unexpectedly large dependencies. See analyzing and reducing bundle size.
- Defer third-party scripts with
next/script, and load chat widgets only when clicked. See loading third-party scripts with next/script.
Keep Expensive Updates Off the Critical Path
When an interaction triggers an expensive render, such as filtering a long list on every keystroke, mark the expensive part as a transition. React then keeps the input responsive and renders the results in the background, abandoning stale renders if the user keeps typing:
// app/products/product-filter.tsx
"use client";

import { useMemo, useState, useTransition } from "react";

type Product = { id: string; name: string; category: string };

export function ProductFilter({ products }: { products: Product[] }) {
  const [query, setQuery] = useState("");
  const [filterQuery, setFilterQuery] = useState("");
  const [isPending, startTransition] = useTransition();

  const visible = useMemo(() => {
    const q = filterQuery.toLowerCase();
    return products.filter((p) => p.name.toLowerCase().includes(q));
  }, [products, filterQuery]);

  return (
    <div>
      <input
        value={query}
        onChange={(e) => {
          const value = e.target.value;
          setQuery(value); // urgent: update the input immediately
          startTransition(() => setFilterQuery(value)); // can wait
        }}
        placeholder="Filter products"
        aria-label="Filter products"
      />
      <ul style={{ opacity: isPending ? 0.6 : 1 }}>
        {visible.map((p) => (
          <li key={p.id}>
            {p.name} <small>{p.category}</small>
          </li>
        ))}
      </ul>
    </div>
  );
}
The input updates on every keystroke with no lag; the list catches up a moment later, dimmed while it's pending. If the list is in the thousands, virtualize it too, so you're only rendering the visible rows.
Yield Long Tasks
When a click handler has to do a lot of non-React work (parsing a file, computing a report, sending analytics), give the browser a chance to paint first:
// lib/yield-to-main.ts
export function yieldToMain(): Promise<void> {
  return new Promise((resolve) => setTimeout(resolve, 0));
}
// in a Client Component
async function handleExport() {
  setStatus("Preparing export…"); // shows immediately
  await yieldToMain(); // let the browser paint the status first
  const csv = buildCsv(rows); // expensive work
  downloadFile(csv, "report.csv");
  setStatus("Done");
}
buildCsv and downloadFile are your own helpers. The pattern is what matters: update the UI, yield, then do the heavy work. The user sees feedback within one frame, which is what INP measures. For work that's heavy enough to block for hundreds of milliseconds, move it to a Web Worker or to the server.
Reduce Unnecessary Re-renders
A click that re-renders the whole page because a context value changed is a common INP problem in larger apps. Split contexts so unrelated consumers don't re-render, keep state close to where it's used, and consider the React Compiler, which Next.js 16 supports with reactCompiler: true in next.config.ts (after installing babel-plugin-react-compiler). It automatically memoizes components and values that would otherwise re-render needlessly.
Fixing CLS
Layout shift happens when something appears or changes size after the surrounding content has rendered. The DevTools Performance panel's Layout Shifts track shows each shift and highlights the elements that moved. Common causes and fixes:
Images and Media Without Dimensions
An img with no dimensions takes up zero height until it loads, then pushes everything down. next/image requires width and height (or fill inside a sized container) precisely to prevent this. For iframe and video embeds, reserve space with CSS:
// app/components/video-embed.tsx
export function VideoEmbed({ src, title }: { src: string; title: string }) {
  return (
    <div className="aspect-video w-full">
      <iframe
        src={src}
        title={title}
        className="h-full w-full"
        loading="lazy"
        allowFullScreen
      />
    </div>
  );
}
Web Fonts
Swapping from a fallback font to a web font with different metrics reflows text. next/font generates a size-adjusted fallback that eliminates most of this shift. Details in font optimization with next/font.
Content Injected Above Existing Content
Cookie banners, promo bars, "Install our app" prompts, and ads that appear at the top of the page after load push everything down. Either:
- Reserve their space in the server-rendered HTML (render a fixed-height container even before the content is known), or
- Overlay them with
position: fixedso they don't affect layout at all, which is usually the right choice for cookie banners.
A promo bar driven by a cookie can be decided on the server, so it's in the initial HTML at its final size instead of popping in after hydration.
Loading States That Don't Match the Final Layout
A loading.tsx skeleton that's 200px tall, replaced by content that's 800px tall, shifts everything below it. Make skeletons match the real layout's dimensions as closely as you can. The same applies to next/dynamic loading placeholders and Suspense fallbacks.
Animations That Change Layout
Animating height, top, margin, or width moves surrounding content and counts as layout shift. Animate transform and opacity instead; they don't affect layout and run on the compositor. Shifts within 500ms of a user interaction (like expanding an accordion after a click) are excluded from CLS, so user-triggered changes are fine; it's the unprompted ones that count.
A Checklist
| Metric | Check |
|---|---|
| LCP | LCP element is server-rendered, not fetched in useEffect |
| LCP | Hero image uses next/image with preload (or fetchPriority="high") and accurate sizes |
| LCP | Pages are prerendered or have a static shell where possible |
| LCP | No request waterfalls in Server Components |
| LCP | LCP element isn't faded in from opacity: 0 by JavaScript |
| INP | "use client" is on small leaf components, not whole pages or layouts |
| INP | Heavy, non-critical components are lazy loaded |
| INP | Third-party scripts use afterInteractive, lazyOnload, or facades |
| INP | Expensive updates use useTransition; long lists are virtualized |
| CLS | All images have dimensions or fill in a sized container |
| CLS | Fonts are loaded with next/font |
| CLS | Banners and ads have reserved space or are overlaid |
| CLS | Skeletons match the final layout |
Verify, Then Watch the Field Data
After a fix, verify it in the lab with the same throttled production build you used to diagnose the problem. Then wait for the field data: CrUX is a rolling 28-day window, so Search Console and PageSpeed Insights take a few weeks to reflect changes. Your own useReportWebVitals reporting will show the effect within days, which is a good reason to set it up before you start optimizing.
Conclusion
Improving Core Web Vitals is mostly about putting the right work in the right place. For LCP, get the main content into the server-rendered HTML, prerender or stream pages, and load the hero image early and small. For INP, keep JavaScript off the main thread by using Server Components, lazy loading, deferring third parties, and marking expensive updates as transitions. For CLS, give every image, embed, font, and banner its final size from the start. Measure with field data, debug with a throttled production build, and fix the metric that's actually failing rather than the one that's easiest to improve.